Capital One 2010 Annual Report Download - page 62
Download and view the complete annual report
Please find page 62 of the 2010 Capital One annual report below. You can navigate through the pages in the report by either clicking on the pages listed below, or by using the keyword search tool below to find specific information within the annual report.-
 1
1 -
2
-
3
-
4
-
5
-
6
-
7
-
8
-
9
-
10
-
11
-
12
-
13
-
14
-
15
-
16
-
17
-
18
-
19
-
20
-
21
-
22
-
23
-
24
-
25
-
26
-
27
-
28
-
29
-
30
-
31
-
32
-
33
-
34
-
35
-
36
-
37
-
38
-
39
-
40
-
41
-
42
-
43
-
44
-
45
-
46
-
47
-
48
-
49
-
50
-
51
-
 52
52 -
 53
53 -
 54
54 -
 55
55 -
 56
56 -
 57
57 -
 58
58 -
 59
59 -
 60
60 -
 61
61 -
 62
62 -
 63
63 -
 64
64 -
 65
65 -
 66
66 -
 67
67 -
 68
68 -
 69
69 -
 70
70 -
 71
71 -
 72
72 -
73
-
74
-
75
-
76
-
77
-
78
-
79
-
80
-
81
-
82
-
83
-
84
-
85
-
86
-
87
-
88
-
89
-
90
-
91
-
92
-
93
-
94
-
95
-
96
-
97
-
98
-
99
-
100
-
101
-
102
-
103
-
104
-
105
-
106
-
107
-
108
-
109
-
110
-
111
-
112
-
113
-
114
-
115
-
116
-
117
-
118
-
119
-
120
-
121
-
122
-
123
-
124
-
125
-
126
-
127
-
128
-
129
-
130
-
131
-
132
-
133
-
134
-
135
-
136
-
137
-
138
-
139
-
140
-
141
-
142
-
143
-
144
-
145
-
146
-
147
-
148
-
149
-
150
-
151
-
152
-
153
-
154
-
155
-
156
-
157
-
158
-
159
-
160
-
161
-
162
-
163
-
164
-
165
-
166
-
167
-
168
-
169
-
170
-
171
-
172
-
173
-
174
-
175
-
176
-
177
-
178
-
179
-
180
-
181
-
182
-
183
-
184
-
185
-
186
-
187
-
188
-
189
-
190
-
191
-
192
-
193
-
194
-
195
-
196
-
197
-
198
-
199
-
200
-
201
-
202
-
203
-
204
-
205
-
206
-
207
-
208
-
209
-
210
-
211
-
212
-
213
-
214
-
215
-
216
-
217
-
218
-
219
-
220
-
221
-
222
-
223
-
224
-
225
-
226
 |
 |

42
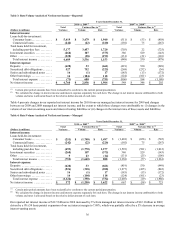
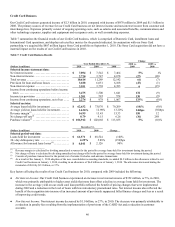
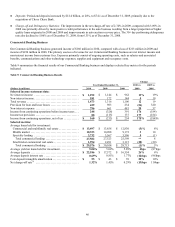
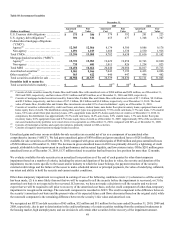
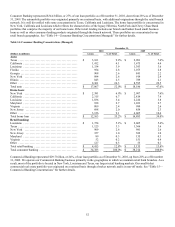
Table 7.1 summarizes the financial results for Domestic Card and displays selected key metrics for the periods indicated. Domestic
Card accounted for 87% of total revenues for our Credit Card business in 2010, compared with 89% in 2009 and 87% in 2008. Income
attributable to Domestic Card represented 83% of income for our Credit Card business for 2010, compared with 94% in both 2009 and
2008. Because our Domestic Card business currently accounts for the substantial majority of our Credit Card business, the key factors
driving the results for this division are similar to the key factors affecting our total Credit Card business.
Table 7.1: Domestic Card Business Results
Change
Year Ended December 31, 2010 vs.
2009
2009 vs.
2008
(Dollars in millions) 2010 2009 2008
Selected income statement data:
N
et interest income ............................ $ 6,912 $ 6,670 $ 6,492 4% 3%
N
on-interest income ............................ 2,347 3,328 4,128 (29) (19)
Total revenue .................................. 9,259 9,998 10,620 (7) (6)
Provision for loan and lease losses ............... 2,853 5,329 5,461 (46) (2)
N
on-interest expense ........................... 3,457 3,256 3,623 6 (10)
Income from continuing operations before income
taxes ........................................ 2,949 1,413 1,536 109 (8)
Income tax provision ........................... 1,051 495 538 112 (8)
Income from continuing operations, net of tax .... $ 1,898 $ 918 $ 998 107% (8)%
Selected metrics:
Average loans held for investment ............... $ 55,133 $ 64,670 $ 68,638 (15)% (6)%
Average yield on loans held for investment ....... 14.09% 12.80% 13.09% 129bps (29)bps
Revenue margin(1) .............................. 16.79 15.46 15.47 133 (1)
N
et charge-off rate(2) ........................... 8.91 9.19 6.33 (28) 286
Purchase volume(3) ............................. $ 98,344 $ 93,566 $ 103,035 5% (9)%
December 31,
(Dollars in millions) 2010 2009 Change
Selected period-end data:
Loans held for investment ...................... $ 53,849 $ 60,300 (11)%
30+ day delinquency rate ....................... 4.09% 5.78% (169)bps
________________________
(1) Revenue margin is calculated by dividing annualized revenues for the period by average loans held for investment during the period.
(2) Net charge-off rate is calculated by dividing annualized net charge-offs for the period by average loans held for investment during the period.
(3) Consists of purchase transactions for the period, net of returns. Excludes cash advance transactions.
Income generated by our Domestic Card division of $1.9 billion in 2010, represented an increase of $980 million over 2009. The
primary factors affecting Domestic Card results for 2010 compared with 2009 included a decline in total revenue due in part to lower
loan balances and a reduction in overlimit and other penalty fees; a significant reduction in the provision for loan and lease losses as
we recorded a substantial allowance release in response to more positive credit performance trends, including decreases in charge-off
and delinquency rates, and an increase in non-interest expense attributable to higher marketing expenditures.
Income generated by our Domestic Card division of $918 million in 2009, reflected a decrease of $80 million from 2008. The primary
factors affecting Domestic Card results for 2009 compared with 2008 included a decline in total revenue primarily due to reduced fees
resulting from the reduction in customer accounts and significantly lower purchase volume, a continued elevated provision for loan
and lease losses due to credit performance deterioration and a decrease in non-interest expense due to significantly curtailed marketing
expenditures.
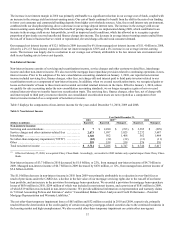
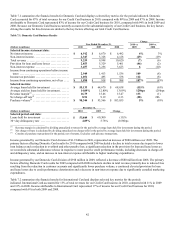
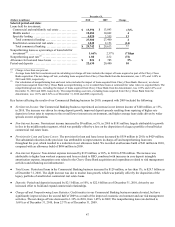
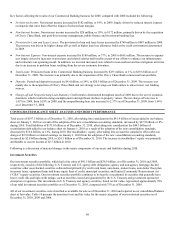
Table 7.2 summarizes the financial results for International Card and displays selected key metrics for the periods
indicated. International Card accounted for 13% of total revenues for our Credit Card business in 2010, compared with 11% in 2009
and 13% in 2008. Income attributable to International Card represented 17% of income for our Credit Card business for 2010,
compared with 6% in both 2009 and 2008.