Capital One 2010 Annual Report Download - page 104
Download and view the complete annual report
Please find page 104 of the 2010 Capital One annual report below. You can navigate through the pages in the report by either clicking on the pages listed below, or by using the keyword search tool below to find specific information within the annual report.-
 1
1 -
2
-
3
-
4
-
5
-
6
-
7
-
8
-
9
-
10
-
11
-
12
-
13
-
14
-
15
-
16
-
17
-
18
-
19
-
20
-
21
-
22
-
23
-
24
-
25
-
26
-
27
-
28
-
29
-
30
-
31
-
32
-
33
-
34
-
35
-
36
-
37
-
38
-
39
-
40
-
41
-
42
-
43
-
44
-
45
-
46
-
47
-
48
-
49
-
50
-
51
-
52
-
53
-
54
-
55
-
56
-
57
-
58
-
59
-
60
-
61
-
62
-
63
-
64
-
65
-
66
-
67
-
68
-
69
-
70
-
71
-
72
-
73
-
74
-
75
-
76
-
77
-
78
-
79
-
80
-
81
-
82
-
83
-
84
-
85
-
86
-
87
-
88
-
89
-
90
-
91
-
92
-
93
-
 94
94 -
 95
95 -
 96
96 -
 97
97 -
 98
98 -
 99
99 -
 100
100 -
 101
101 -
 102
102 -
 103
103 -
 104
104 -
 105
105 -
 106
106 -
 107
107 -
 108
108 -
 109
109 -
 110
110 -
 111
111 -
 112
112 -
 113
113 -
 114
114 -
115
-
116
-
117
-
118
-
119
-
120
-
121
-
122
-
123
-
124
-
125
-
126
-
127
-
128
-
129
-
130
-
131
-
132
-
133
-
134
-
135
-
136
-
137
-
138
-
139
-
140
-
141
-
142
-
143
-
144
-
145
-
146
-
147
-
148
-
149
-
150
-
151
-
152
-
153
-
154
-
155
-
156
-
157
-
158
-
159
-
160
-
161
-
162
-
163
-
164
-
165
-
166
-
167
-
168
-
169
-
170
-
171
-
172
-
173
-
174
-
175
-
176
-
177
-
178
-
179
-
180
-
181
-
182
-
183
-
184
-
185
-
186
-
187
-
188
-
189
-
190
-
191
-
192
-
193
-
194
-
195
-
196
-
197
-
198
-
199
-
200
-
201
-
202
-
203
-
204
-
205
-
206
-
207
-
208
-
209
-
210
-
211
-
212
-
213
-
214
-
215
-
216
-
217
-
218
-
219
-
220
-
221
-
222
-
223
-
224
-
225
-
226
 |
 |

84
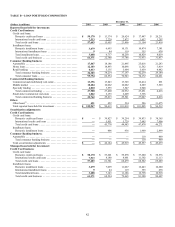
TABLE C—DELINQUENCIES
December 31,
2010(2) 2009(2) 2008 2007 2006
(Dollars in millions) Loans
% of
Total
Loans Loans
% of
Total
Loans Loans
% of
Total
Loans Loans
% of
Total
Loans Loans
% of
Total
Loans
Reported:(1)
Loans held for
investment ........ $ 125,947 100.00 % $ 90,619 100.00% $ 101,018 100.00% $ 101,805 100.00 % $ 96,512 100.00%
Delinquent loans:
30-59 days ....... $ 1,968 1.56 % $ 1,908 2.10% $ 2,325 2.30% $ 2,052 2.02 % $ 1,512 1.57%
60-89 days ....... 1,064 0.84 985 1.09 1,094 1.08 869 0.86 563 0.58
90-119 days ...... 559 0.44 356 0.39 410 0.41 290 0.28 210 0.22
120-149 days ..... 446 0.35 190 0.21 230 0.23 195 0.19 167 0.17
150 or more days .. 393 0.31 164 0.18 194 0.19 155 0.15 114 0.12
Total ............ $ 4,430 3.52 % $ 3,603 3.98% $ 4,253 4.21% $ 3,561 3.50 % $ 2,566 2.66%
By geographic area:
Domestic ......... $ 3,998 3.38 % $ 3,460 3.82% $ 4,107 4.07% $ 3,433 3.37 % $ 2,461 2.55%
International ...... 432 5.75 143 6.28 146 4.89 128 3.20 105 2.74
Total ............ $ 4,430 3.52 % $ 3,603 3.98% $ 4,253 4.21% $ 3,561 3.50 % $ 2,566 2.66%
Managed:(1)
Loans held for
investment ........ $ 125,947 100.00 % $ 136,803 100.00% $ 146,937 100.00% $ 151,362 100.00 % $ 146,151 100.00%
Delinquent loans:
30-59 days ....... $ 1,968 1.56 % $ 2,623 1.92% $ 2,987 2.03% $ 2,738 1.81 % $ 2,130 1.46%
60-89 days ....... 1,064 0.84 1,576 1.15 1,582 1.08 1,343 0.89 946 0.65
90-119 days ...... 559 0.44 895 0.65 817 0.60 681 0.45 521 0.41
120-149 days ..... 446 0.35 660 0.48 569 0.39 513 0.34 412 0.28
150 or more days .. 393 0.31 568 0.42 476 0.32 429 0.28 323 0.22
Total ............ $ 4,430 3.52 % $ 6,322 4.62% $ 6,431 4.38% $ 5,704 3.77 % $ 4,332 2.96%
By geographic area:
Domestic ......... $ 3,998 3.38 % $ 5,783 4.23% $ 5,915 4.03% $ 5,112 3.34 % $ 3,743 3.18%
International ...... 432 5.75 539 6.55 516 5.92 592 5.08 589 5.02
Total ............ $ 4,430 3.52 % $ 6,322 4.62% $ 6,431 4.38% $ 5,704 3.77 % $ 4,332 2.96%
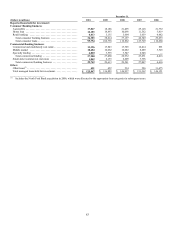
________________________
(1) Includes credit card loans that continue to accrue finance charges and fees until charged-off at 180 days. The amounts reported for credit card
loans are net of billed finance charges and fees that we do not expect to collect. In accordance with our finance charge and fee revenue
recognition policy, amounts billed but not included in revenue totaled $950 million, $2.1 billion, $1.9 billion, $1.1 billion and $0.9 billion in
2010, 2009, 2008, 2007 and 2006, respectively.
(2) The Chevy Chase Bank acquired loan portfolio is included in loans held for investment, but excluded from delinquent loans as these loans are
considered performing in accordance with our expectations as of the purchase date, as we recorded these loans at estimated fair value when we
acquired them. As of December 31, 2010 and 2009, the acquired loan portfolio’s contractual 30 to 89 day delinquencies total $199 million and
$294 million, respectively. For loans 90+ days past due, see Table D—Nonperforming Assets.