Capital One 2010 Annual Report Download - page 139
Download and view the complete annual report
Please find page 139 of the 2010 Capital One annual report below. You can navigate through the pages in the report by either clicking on the pages listed below, or by using the keyword search tool below to find specific information within the annual report.-
 1
1 -
2
-
3
-
4
-
5
-
6
-
7
-
8
-
9
-
10
-
11
-
12
-
13
-
14
-
15
-
16
-
17
-
18
-
19
-
20
-
21
-
22
-
23
-
24
-
25
-
26
-
27
-
28
-
29
-
30
-
31
-
32
-
33
-
34
-
35
-
36
-
37
-
38
-
39
-
40
-
41
-
42
-
43
-
44
-
45
-
46
-
47
-
48
-
49
-
50
-
51
-
52
-
53
-
54
-
55
-
56
-
57
-
58
-
59
-
60
-
61
-
62
-
63
-
64
-
65
-
66
-
67
-
68
-
69
-
70
-
71
-
72
-
73
-
74
-
75
-
76
-
77
-
78
-
79
-
80
-
81
-
82
-
83
-
84
-
85
-
86
-
87
-
88
-
89
-
90
-
91
-
92
-
93
-
94
-
95
-
96
-
97
-
98
-
99
-
100
-
101
-
102
-
103
-
104
-
105
-
106
-
107
-
108
-
109
-
110
-
111
-
112
-
113
-
114
-
115
-
116
-
117
-
118
-
119
-
120
-
121
-
122
-
123
-
124
-
125
-
126
-
127
-
128
-
 129
129 -
 130
130 -
 131
131 -
 132
132 -
 133
133 -
 134
134 -
 135
135 -
 136
136 -
 137
137 -
 138
138 -
 139
139 -
 140
140 -
 141
141 -
 142
142 -
 143
143 -
 144
144 -
 145
145 -
 146
146 -
 147
147 -
 148
148 -
 149
149 -
150
-
151
-
152
-
153
-
154
-
155
-
156
-
157
-
158
-
159
-
160
-
161
-
162
-
163
-
164
-
165
-
166
-
167
-
168
-
169
-
170
-
171
-
172
-
173
-
174
-
175
-
176
-
177
-
178
-
179
-
180
-
181
-
182
-
183
-
184
-
185
-
186
-
187
-
188
-
189
-
190
-
191
-
192
-
193
-
194
-
195
-
196
-
197
-
198
-
199
-
200
-
201
-
202
-
203
-
204
-
205
-
206
-
207
-
208
-
209
-
210
-
211
-
212
-
213
-
214
-
215
-
216
-
217
-
218
-
219
-
220
-
221
-
222
-
223
-
224
-
225
-
226
 |
 |

CAPITAL ONE FINANCIAL CORPORATION
NOTES TO CONSOLIDATED STATEMENTS
119
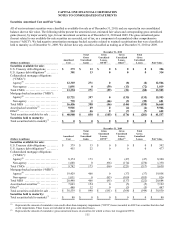
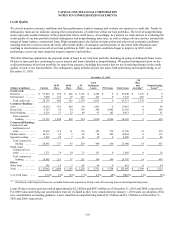
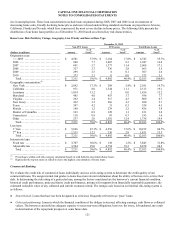
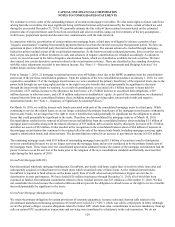
Credit Card
Our credit card loan portfolio is generally highly diversified across millions of accounts and multiple geographies without significant
individual exposures. We therefore generally manage credit risk on a portfolio basis. The risk in our credit card portfolio is correlated
with broad economic trends, such as unemployment rates, gross domestic product (“GDP”) growth, and home values, as well as
customer liquidity, which can have a material effect on credit performance. The primary factors we assess in monitoring the credit
quality and risk of our credit card portfolio are delinquency and charge-off trends, including an analysis of the migration of loans
between delinquency categories over time. The table below displays the geographic profile of our credit card loan portfolio and
delinquency statistics as of December 31, 2010. We also present net-charge offs in 2010.
Credit Card: Risk Profile by Geographic Region and Delinquency Status
December 31, 2010
(Dollars in millions) Amount % of
Total(1)
Domestic:
California .............................................................................
.
$ 6,242 10.2%
Texas .................................................................................
.
3,633 5.9
N
ew York .............................................................................
.
3,599 5.8
Florida ................................................................................
.
3,298 5.4
Illinois ................................................................................
.
2,403 3.9
Pennsylvania ..........................................................................
.
2,389 3.9
Ohio ..................................................................................
.
2,109 3.4
N
ew Jersey ............................................................................
.
1,971 3.2
Michigan ..............................................................................
.
1,716 2.8
Other .................................................................................
.
26,489 43.2
Total Domestic Card .................................................................
.
53,849 87.7
International:
United Kingdom .......................................................................
.
4,102 6.7
Canada ................................................................................
.
3,420 5.6
Total International Card ..............................................................
.
7,522 12.3
Total Credit Card ....................................................................
.
$ 61,371 100.0%
Credit performance:
30+ day delinquencies(2) ................................................................
.
$ 2,632 4.29%
90+ day delinquencies(2) ................................................................
.
1,379 1.10
N
et charge-offs(3) .......................................................................
.
5,499 8.79
________________________
(1) Percentages by geographic region within the domestic and international credit card portfolios are calculated based on the total held-for-
investment credit card loans as of the end of the reported period.
(2) Delinquency rates calculated by dividing delinquent credit card loans by the total balance of credit card loans held for investment as of the end
of the reported period.
(3) Calculated by dividing net charge-offs by average credit card loans held for investment during 2010.
The 30-day delinquency rate for our entire credit card loan portfolio, which consists of loans we own and loans underlying our
securitization trusts that were accounted for as off-balance sheet prior to our January 1, 2010 adoption of the new consolidation
accounting standards, decreased to 4.29% as of December 31, 2010, from 5.88% as of December 31, 2009.
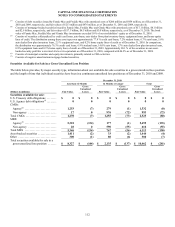
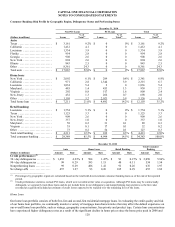
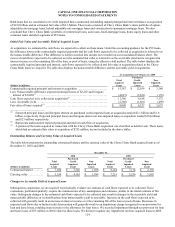
Consumer Banking
Our consumer banking loan portfolio consists of auto, home loan and retail banking loans. Similar to our credit card loan portfolio, the
risk in our consumer banking loan portfolio is correlated with broad economic trends, such as unemployment rates, gross domestic
product (“GDP”) growth, and home values, as well as customer liquidity, which can have a material effect on credit performance.
Delinquency, nonperforming loans and charge-off trends are key factors we assess in monitoring the credit quality and risk of our
consumer banking loan portfolio. The table below displays the geographic profile of our consumer banking loan portfolio, including
PCI loans acquired from Chevy Chase Bank. We also present the delinquency and nonperforming loan rates of our consumer banking
loan portfolio, excluding PCI loans, as of December 31, 2010 and net-charge offs in 2010.