Capital One 2010 Annual Report Download - page 142
Download and view the complete annual report
Please find page 142 of the 2010 Capital One annual report below. You can navigate through the pages in the report by either clicking on the pages listed below, or by using the keyword search tool below to find specific information within the annual report.-
 1
1 -
2
-
3
-
4
-
5
-
6
-
7
-
8
-
9
-
10
-
11
-
12
-
13
-
14
-
15
-
16
-
17
-
18
-
19
-
20
-
21
-
22
-
23
-
24
-
25
-
26
-
27
-
28
-
29
-
30
-
31
-
32
-
33
-
34
-
35
-
36
-
37
-
38
-
39
-
40
-
41
-
42
-
43
-
44
-
45
-
46
-
47
-
48
-
49
-
50
-
51
-
52
-
53
-
54
-
55
-
56
-
57
-
58
-
59
-
60
-
61
-
62
-
63
-
64
-
65
-
66
-
67
-
68
-
69
-
70
-
71
-
72
-
73
-
74
-
75
-
76
-
77
-
78
-
79
-
80
-
81
-
82
-
83
-
84
-
85
-
86
-
87
-
88
-
89
-
90
-
91
-
92
-
93
-
94
-
95
-
96
-
97
-
98
-
99
-
100
-
101
-
102
-
103
-
104
-
105
-
106
-
107
-
108
-
109
-
110
-
111
-
112
-
113
-
114
-
115
-
116
-
117
-
118
-
119
-
120
-
121
-
122
-
123
-
124
-
125
-
126
-
127
-
128
-
129
-
130
-
131
-
 132
132 -
 133
133 -
 134
134 -
 135
135 -
 136
136 -
 137
137 -
 138
138 -
 139
139 -
 140
140 -
 141
141 -
 142
142 -
 143
143 -
 144
144 -
 145
145 -
 146
146 -
 147
147 -
 148
148 -
 149
149 -
 150
150 -
 151
151 -
 152
152 -
153
-
154
-
155
-
156
-
157
-
158
-
159
-
160
-
161
-
162
-
163
-
164
-
165
-
166
-
167
-
168
-
169
-
170
-
171
-
172
-
173
-
174
-
175
-
176
-
177
-
178
-
179
-
180
-
181
-
182
-
183
-
184
-
185
-
186
-
187
-
188
-
189
-
190
-
191
-
192
-
193
-
194
-
195
-
196
-
197
-
198
-
199
-
200
-
201
-
202
-
203
-
204
-
205
-
206
-
207
-
208
-
209
-
210
-
211
-
212
-
213
-
214
-
215
-
216
-
217
-
218
-
219
-
220
-
221
-
222
-
223
-
224
-
225
-
226
 |
 |

CAPITAL ONE FINANCIAL CORPORATION
NOTES TO CONSOLIDATED STATEMENTS
122
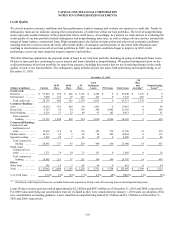
● Criticized nonperforming: Loans that are not adequately protected by the current sound worth and paying capacity of the obligor
or the collateral pledged, if any. Loans classified as criticized nonperforming have a well-defined weakness, or weaknesses, which
jeopardize the repayment of the debt. These loans are characterized by the distinct possibility that we will sustain a credit loss if
the deficiencies are not corrected.
We use our internal risk-rating system for regulatory reporting, determining the frequency of review of the credit exposures and
evaluation and determination of the allowance for commercial loans. Loans of $1 million or more designated as criticized performing
and criticized nonperforming are reviewed quarterly by management for further deterioration or improvement to determine if they are
appropriately classified/graded and whether impairment exists. All other loans greater than $1 million are specifically reviewed at
least annually to determine the appropriate loan grading. In addition, during the renewal process of any loan, as well if a loan becomes
past due, we evaluate the risk rating.
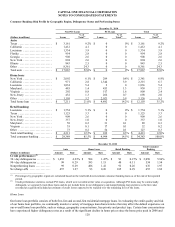
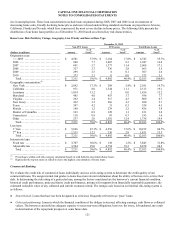
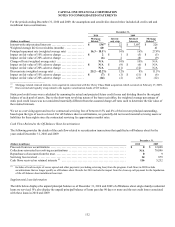
The following table presents the geographic distribution and internal risk ratings of our commercial loan portfolio as of December 31,
2010.
Commercial: Risk Profile by Geographic Region and Internal Risk Rating(1)
December 31, 2010
(Dollars in millions)
Commercial &
Multifamily
Real Estate
% of
Total(2)
Middle
Market
% of
Total(2)
Specialty
Lending
% of
Total(2)
Small-ticket
Commercial
Real Estate
% of
Total(2)
Total
Commercial
% of
Total(2)
Geographic concentration:(3)
Non-PCI loans:
N
ortheast ................... $ 10,849 81.0% $ 3,240 30.9% $ 1,548 38.5% $ 1,137 61.7 % $ 16,774 56.4%
Mid-Atlantic ................ 720 5.4 960 9.2 185 4.6 71 3.9 1,936 6.5
South ..................... 1,315 9.8 5,191 49.5 733 18.2 119 6.5 7,358 24.7
Other ..................... 234 1.8 811 7.7 1,554 38.7 515 27.9 3,114 10.5
Total non-PCI loans ........... 13,118 98.0 10,202 97.3 4,020 100.0 1,842 100.0 29,182 98.1
PCI loans .................. 278 2.0 282 2.7 0 0.0 0 0.0 560 1.9
Total ...................... $ 13,396 100.0% $ 10,484 100.0% $ 4,020 100.0% $ 1,842 100.0 % $ 29,742 100.0%
Internal risk rating:(4)
N
on-PCI loans:
N
oncriticized ................ $ 11,611 86.7% $ 9,445 90.1% $ 3,897 96.9% $ 1,710 92.8 % $ 26,663 89.6%
Criticized performing .......... 1,231 9.2 624 6.0 75 1.9 95 5.2 2,025 6.8
Criticized nonperforming ....... 276 2.1 133 1.2 48 1.2 37 2.0 494 1.7
Total non-PCI loans ........... 13,118 98.0 10,202 97.3 4,020 100.0 1,842 100.0 29,182 98.1
PCI loans:
N
oncriticized ................ $ 186 1.3% $ 235 2.3% $ 0 0.0% $ 0 0.0 % $ 421 1.4%
Criticized performing .......... 92 0.7 47 0.4 0 0.0 0 0.0 139 0.5
Criticized nonperforming ....... 0 0.0 0 0.0 0 0.0 0 0.0 0 0.0
Total PCI loans .............. 278 2.0 282 2.7 0 0.0 0 0.0 560 1.9
Total ...................... $ 13,396 100.0% $ 10,484 100.0% $ 4,020 100.0% $ 1,842 100.0 % $ 29,742 100.0%
________________________
(1) Amounts based on managed loans as of December 31, 2010.
(2) Percentages calculated based on total held-for-investment commercial loans in each respective loan category as of the end of the reported
period.
(3) Northeast consists of CT, ME, MA, NH, NJ, NY, PA and VT. Mid-Atlantic consists of DE, DC, MD, VA and WV. South consists of AL, AR,
FL, GA, KY, LA, MS, MO, NC, SC, TN and TX.
(4) Criticized exposures correspond to the “Special Mention,” “Substandard” and “Doubtful” asset categories defined by banking regulatory
authorities.