Capital One 2010 Annual Report Download - page 168
Download and view the complete annual report
Please find page 168 of the 2010 Capital One annual report below. You can navigate through the pages in the report by either clicking on the pages listed below, or by using the keyword search tool below to find specific information within the annual report.-
 1
1 -
2
-
3
-
4
-
5
-
6
-
7
-
8
-
9
-
10
-
11
-
12
-
13
-
14
-
15
-
16
-
17
-
18
-
19
-
20
-
21
-
22
-
23
-
24
-
25
-
26
-
27
-
28
-
29
-
30
-
31
-
32
-
33
-
34
-
35
-
36
-
37
-
38
-
39
-
40
-
41
-
42
-
43
-
44
-
45
-
46
-
47
-
48
-
49
-
50
-
51
-
52
-
53
-
54
-
55
-
56
-
57
-
58
-
59
-
60
-
61
-
62
-
63
-
64
-
65
-
66
-
67
-
68
-
69
-
70
-
71
-
72
-
73
-
74
-
75
-
76
-
77
-
78
-
79
-
80
-
81
-
82
-
83
-
84
-
85
-
86
-
87
-
88
-
89
-
90
-
91
-
92
-
93
-
94
-
95
-
96
-
97
-
98
-
99
-
100
-
101
-
102
-
103
-
104
-
105
-
106
-
107
-
108
-
109
-
110
-
111
-
112
-
113
-
114
-
115
-
116
-
117
-
118
-
119
-
120
-
121
-
122
-
123
-
124
-
125
-
126
-
127
-
128
-
129
-
130
-
131
-
132
-
133
-
134
-
135
-
136
-
137
-
138
-
139
-
140
-
141
-
142
-
143
-
144
-
145
-
146
-
147
-
148
-
149
-
150
-
151
-
152
-
153
-
154
-
155
-
156
-
157
-
 158
158 -
 159
159 -
 160
160 -
 161
161 -
 162
162 -
 163
163 -
 164
164 -
 165
165 -
 166
166 -
 167
167 -
 168
168 -
 169
169 -
 170
170 -
 171
171 -
 172
172 -
 173
173 -
 174
174 -
 175
175 -
 176
176 -
 177
177 -
 178
178 -
179
-
180
-
181
-
182
-
183
-
184
-
185
-
186
-
187
-
188
-
189
-
190
-
191
-
192
-
193
-
194
-
195
-
196
-
197
-
198
-
199
-
200
-
201
-
202
-
203
-
204
-
205
-
206
-
207
-
208
-
209
-
210
-
211
-
212
-
213
-
214
-
215
-
216
-
217
-
218
-
219
-
220
-
221
-
222
-
223
-
224
-
225
-
226
 |
 |

CAPITAL ONE FINANCIAL CORPORATION
NOTES TO CONSOLIDATED STATEMENTS
148
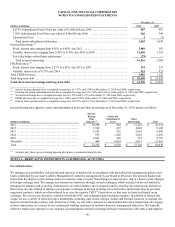
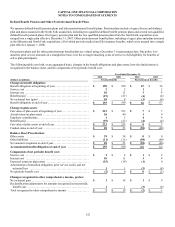
NOTE 14—EARNINGS PER COMMON SHARE
The following table sets forth the computation of basic and diluted earnings per common share:
Year Ended December 31,
(Dollars and Shares in millions, except per share data) 2010 2009 2008
Numerator:
Income from continuing operations, net of tax ..................................
.
$ 3,050 $ 987 $ 85
Loss from discontinued operations, net of tax ...................................
.
(307) (103) (131)
N
et income (loss) ............................................................
.
2,743 884 (46)
Preferred stock dividends and accretion of discount .............................
.
0 (564) (33)
N
et income (loss) available to common stockholders ............................
.
$ 2,743 $ 320 $ (79)
Denominator:
Denominator for basic earnings per share-Weighted-average shares ..............
.
452 428 376
Effect of dilutive securities (1) :
Stock options ..............................................................
.
1 0 0
Contingently issuable shares ................................................
.
0 0 0
Restricted stock and units ...................................................
.
3 3 2
Dilutive potential common shares .............................................
.
4 3 2
Denominator for diluted earnings per share-Adjusted weighted-average shares ....
.
456 431 378
Basic earnings per share
Income from continuing operations ............................................
.
$ 6.74 $ 0.99 $ 0.14
Loss from discontinued operations .............................................
.
(0.67) (0.24) (0.35)
N
et income (loss) ............................................................
.
$ 6.07 $ 0.75 $ (0.21)
Diluted earnings per share
Income from continuing operations ............................................
.
$ 6.68 $ 0.98 $ 0.14
Loss from discontinued operations .............................................
.
(0.67) (0.24) (0.35)
N
et income (loss) ............................................................
.
$ 6.01 $ 0.74 $ (0.21)
________________________
(1) Excluded from the computation of diluted earnings per share was 26.8 million, 34.8 million and 27.7 million of awards, options or warrants,
during 2010, 2009 and 2008, respectively, because their inclusion would be antidilutive.
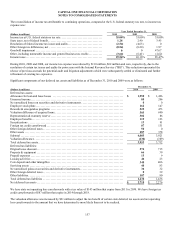
NOTE 15—OTHER NON-INTEREST EXPENSE
The following table represents the components of non-interest expense for 2010, 2009 and 2008:
Year Ended December 31,
(Dollars in millions) 2010 2009 2008
Professional services .........................................................
.
$ 916 $ 796 $ 806
Collections ..................................................................
.
596 599 569
Fraud losses .................................................................
.
80 86 106
Bankcard association assessments .............................................
.
221 215 195
Core deposit intangible amortization ...........................................
.
203 216 191
Other .......................................................................
.
667 629 1,102
Total ........................................................................
.
$ 2,683 $ 2,541 $ 2,969
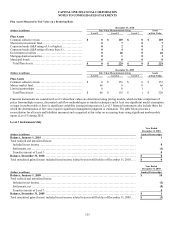
NOTE 16—STOCK-BASED COMPENSATION PLAN
Stock Plans
We have one active stock-based employee compensation plan. Under the plan, we reserve common shares for issuance in various
forms including incentive stock options, nonstatutory stock options, stock appreciation rights, restricted stock awards, restricted stock
units, and performance share units.