Capital One 2010 Annual Report Download - page 184
Download and view the complete annual report
Please find page 184 of the 2010 Capital One annual report below. You can navigate through the pages in the report by either clicking on the pages listed below, or by using the keyword search tool below to find specific information within the annual report.-
 1
1 -
2
-
3
-
4
-
5
-
6
-
7
-
8
-
9
-
10
-
11
-
12
-
13
-
14
-
15
-
16
-
17
-
18
-
19
-
20
-
21
-
22
-
23
-
24
-
25
-
26
-
27
-
28
-
29
-
30
-
31
-
32
-
33
-
34
-
35
-
36
-
37
-
38
-
39
-
40
-
41
-
42
-
43
-
44
-
45
-
46
-
47
-
48
-
49
-
50
-
51
-
52
-
53
-
54
-
55
-
56
-
57
-
58
-
59
-
60
-
61
-
62
-
63
-
64
-
65
-
66
-
67
-
68
-
69
-
70
-
71
-
72
-
73
-
74
-
75
-
76
-
77
-
78
-
79
-
80
-
81
-
82
-
83
-
84
-
85
-
86
-
87
-
88
-
89
-
90
-
91
-
92
-
93
-
94
-
95
-
96
-
97
-
98
-
99
-
100
-
101
-
102
-
103
-
104
-
105
-
106
-
107
-
108
-
109
-
110
-
111
-
112
-
113
-
114
-
115
-
116
-
117
-
118
-
119
-
120
-
121
-
122
-
123
-
124
-
125
-
126
-
127
-
128
-
129
-
130
-
131
-
132
-
133
-
134
-
135
-
136
-
137
-
138
-
139
-
140
-
141
-
142
-
143
-
144
-
145
-
146
-
147
-
148
-
149
-
150
-
151
-
152
-
153
-
154
-
155
-
156
-
157
-
158
-
159
-
160
-
161
-
162
-
163
-
164
-
165
-
166
-
167
-
168
-
169
-
170
-
171
-
172
-
173
-
 174
174 -
 175
175 -
 176
176 -
 177
177 -
 178
178 -
 179
179 -
 180
180 -
 181
181 -
 182
182 -
 183
183 -
 184
184 -
 185
185 -
 186
186 -
 187
187 -
 188
188 -
 189
189 -
 190
190 -
 191
191 -
 192
192 -
 193
193 -
 194
194 -
195
-
196
-
197
-
198
-
199
-
200
-
201
-
202
-
203
-
204
-
205
-
206
-
207
-
208
-
209
-
210
-
211
-
212
-
213
-
214
-
215
-
216
-
217
-
218
-
219
-
220
-
221
-
222
-
223
-
224
-
225
-
226
 |
 |
CAPITAL ONE FINANCIAL CORPORATION
NOTES TO CONSOLIDATED STATEMENTS
164
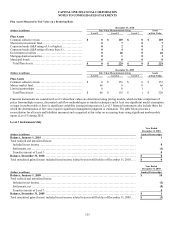
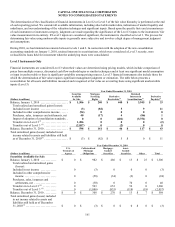
The following describes the valuation techniques used in estimating the fair value of our financial instruments as of December 31,
2010 and 2009. We applied the fair value provisions, to the financial instruments not recognized on the consolidated balance sheet at
fair value, which include loans held for investment, interest receivable, non-interest bearing and interest bearing deposits, other
borrowings, senior and subordinated notes, and interest payable. The provisions requiring us to maximize the use of observable inputs
and to measure fair value using a notion of exit price were factored into our selection of inputs of our established valuation techniques.
Financial Assets
Cash and Cash Equivalents
The carrying amounts of cash and due from banks, federal funds sold and resale agreements and interest-bearing deposits at other
banks approximate fair value.
Restricted Cash or Securitization Investors
The carrying amounts of restricted cash for securitization investors approximate their fair value due to their relatively short-term
nature.
Securities Held To Maturity
The carrying amounts of securities held to maturity, which consists of negative amortization bonds, approximate fair value. We
recorded these securities at fair value on the date of acquisition. Fair value is determined using a discounted cash flow method, a form
of the income approach. Discount rates were determined considering market rates at which similar instruments would be sold to third
parties.
Securities Available For Sale
Quoted prices in active markets are used to measure the fair value of U.S. Treasury securities. For other investment categories, we
utilize multiple third party pricing services to obtain fair value measures for the large majority of our securities. A pricing service may
be considered as the primary pricing provider for certain types of securities, and the designation of the primary pricing provider may
vary depending on the type of securities. The determination of the primary pricing provider is based on our experience and validation
benchmark of the pricing service’s performance in terms of providing fair value measurement for the various types of securities.
Certain securities available for sale are classified as Level 2 and 3, the majority of which are collateralized mortgage obligations and
mortgage-backed securities. Classification indicates that significant valuation assumptions are not consistently observable in the
market. When significant assumptions are not consistently observable, fair values are derived using the best available data. Such data
may include quotes provided by a dealer, the use of external pricing services, independent pricing models, or other model-based
valuation techniques such as calculation of the present values of future cash flows incorporating assumptions such as benchmark
yields, spreads, prepayment speeds, credit ratings, and losses. The techniques used by the pricing services utilize observable market
data to the extent available. Pricing models may be used, which can vary by asset class and may incorporate available trade, bid and
other market information. Across asset classes, information such as trader/dealer input, credit spreads, forward curves, and
prepayment speeds are used to help determine appropriate valuations. Because many fixed income securities do not trade on a daily
basis, the evaluated pricing applications may apply available information through processes such as benchmarking curves, like
securities, sector groupings, and matrix pricing to prepare valuations. In addition, model processes are used by the pricing services to
develop prepayment and interest rate scenarios.
We validate the pricing obtained from the primary pricing providers through comparison of pricing to additional sources, including
other pricing services, dealer pricing indications in transaction results, and other internal sources. Pricing variances among different
pricing sources are analyzed and validated.
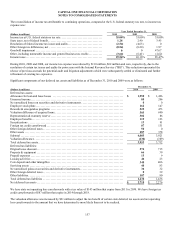
As of December 31, 2010, we saw significant improvements in the market value of our portfolio holdings driven by stabilization of
the financial markets and reduced risk premiums as compared to 2009. The decrease in the amount of Level 3 securities reflected
continued run-off of the securities, the liquidation of our CMBS and MBS securities, and improvement in pricing consistency.