Capital One 2010 Annual Report Download - page 69
Download and view the complete annual report
Please find page 69 of the 2010 Capital One annual report below. You can navigate through the pages in the report by either clicking on the pages listed below, or by using the keyword search tool below to find specific information within the annual report.-
 1
1 -
2
-
3
-
4
-
5
-
6
-
7
-
8
-
9
-
10
-
11
-
12
-
13
-
14
-
15
-
16
-
17
-
18
-
19
-
20
-
21
-
22
-
23
-
24
-
25
-
26
-
27
-
28
-
29
-
30
-
31
-
32
-
33
-
34
-
35
-
36
-
37
-
38
-
39
-
40
-
41
-
42
-
43
-
44
-
45
-
46
-
47
-
48
-
49
-
50
-
51
-
52
-
53
-
54
-
55
-
56
-
57
-
58
-
 59
59 -
 60
60 -
 61
61 -
 62
62 -
 63
63 -
 64
64 -
 65
65 -
 66
66 -
 67
67 -
 68
68 -
 69
69 -
 70
70 -
 71
71 -
 72
72 -
 73
73 -
 74
74 -
 75
75 -
 76
76 -
 77
77 -
 78
78 -
 79
79 -
80
-
81
-
82
-
83
-
84
-
85
-
86
-
87
-
88
-
89
-
90
-
91
-
92
-
93
-
94
-
95
-
96
-
97
-
98
-
99
-
100
-
101
-
102
-
103
-
104
-
105
-
106
-
107
-
108
-
109
-
110
-
111
-
112
-
113
-
114
-
115
-
116
-
117
-
118
-
119
-
120
-
121
-
122
-
123
-
124
-
125
-
126
-
127
-
128
-
129
-
130
-
131
-
132
-
133
-
134
-
135
-
136
-
137
-
138
-
139
-
140
-
141
-
142
-
143
-
144
-
145
-
146
-
147
-
148
-
149
-
150
-
151
-
152
-
153
-
154
-
155
-
156
-
157
-
158
-
159
-
160
-
161
-
162
-
163
-
164
-
165
-
166
-
167
-
168
-
169
-
170
-
171
-
172
-
173
-
174
-
175
-
176
-
177
-
178
-
179
-
180
-
181
-
182
-
183
-
184
-
185
-
186
-
187
-
188
-
189
-
190
-
191
-
192
-
193
-
194
-
195
-
196
-
197
-
198
-
199
-
200
-
201
-
202
-
203
-
204
-
205
-
206
-
207
-
208
-
209
-
210
-
211
-
212
-
213
-
214
-
215
-
216
-
217
-
218
-
219
-
220
-
221
-
222
-
223
-
224
-
225
-
226
 |
 |

49
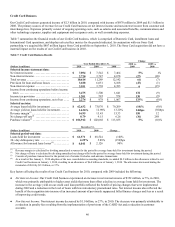
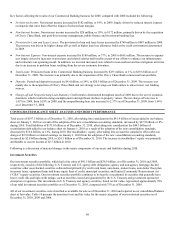
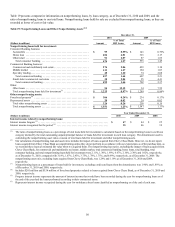
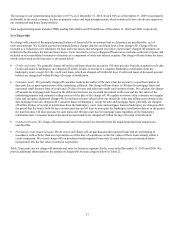
Table 10: Investment Securities
December 31,
2010 2009 2008
(Dollars in millions) Amortized
Cost Fair
Value Amortized
Cost Fair
Value Amortized
Cost Fair
Value
U.S. Treasury debt obligations ........... $ 373 $ 386 $ 379 $ 392 $ 201 $ 223
U.S. Agency debt obligations(1) ........... 301 314 455 477 1,348 1,387
Collateralized mortgage obligations
(“CMO”):
Agency(2) ............................. 12,303 12,566 8,174 8,300 9,086 9,176
Non-agency .......................... 1,091 1,019 1,608 1,338 2,530 1,926
Total CMOs ............................. 13,394 13,585 9,782 9,638 11,616 11,102
Mortgage-backed securities (“MBS”):
Agency(2) ............................. 15,721 15,983 19,429 19,858 12,763 12,890
Non-agency .......................... 735 681 1,011 826 1,254 823
Total MBS ............................. 16,456 16,664 20,440 20,684 14,017 13,713
Asset-backed securities(3) ................ 9,901 9,966 7,043 7,192 4,433 4,096
Other securities(4) ....................... 563 622 440 447 496 482
Total securities available for sale ......... $ 40,988 $ 41,537 $ 38,539 $ 38,830 $ 32,111 $ 31,003
Securities held to maturity:
Total securities held to maturity .......... $
—
$
—
$ 80(5) $ 80(5) $
—
$
—
________________________
(1) Consists of debt securities issued by Fannie Mae and Freddie Mac with amortized costs of $200 million and $454 million, as of December 31,
2010 and 2009, respectively, and fair values of $213 million and $476 million, as of December 31, 2010 and 2009, respectively.
(2) Consists of mortgage-backed securities issued by Fannie Mae, Freddie Mac and Ginnie Mae with amortized costs of $17.1 billion, $8.1 billion
and $2.9 billion, respectively, and fair values of $17.3 billion, $8.3 billion and $3.0 billion, respectively, as of December 31, 2010. The book
value of Fannie Mae, Freddie Mac and Ginnie Mae investments exceeded 10% of our stockholders’ equity as of December 31, 2010.
(3) Consists of securities collateralized by credit card loans, auto loans, student loans, auto dealer floor plan inventory loans, equipment loans and
home equity lines of credit. The distribution among these asset types was approximately 77.8% credit card loans, 6.7% auto loans, 7.2% student
loans, 5.6% auto dealer floor plan inventory loans, 2.5% equipment loans and 0.2% home equity lines of credit as of December 31, 2010. In
comparison, the distribution was approximately 76.3% credit card loans, 14.0% auto loans, 6.9% student loans, 1.7% auto dealer floor plan
inventory loans, 0.8% equipment loans and 0.3% home equity lines of credit as of December 31, 2009. Approximately 90% of the securities in
our asset-backed security portfolio were rated AAA or its equivalent as of December 31, 2010, compared with 84% as of December 31, 2009.
(4) Consists of municipal securities and equity investments, primarily related to CRA activities.
(5) Consists of negative amortization mortgage-backed securities.
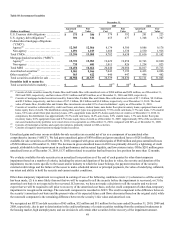
Unrealized gains and losses on our available-for-sale securities are recorded net of tax as a component of accumulated other
comprehensive income (“AOCI”). We had gross unrealized gains of $830 million and gross unrealized losses of $281 million on
available-for sale securities as of December 31, 2010, compared with gross unrealized gains of $840 million and gross unrealized losses
of $549 million as of December 31, 2009. The decrease in gross unrealized losses in 2010 was primarily driven by a tightening of credit
spreads, attributable to the improvement in credit performance and increased liquidity, and lower interest rates. Of the $281 million gross
unrealized losses as of December 31, 2010, $137 million related to securities that had been in a loss position for more than 12 months.
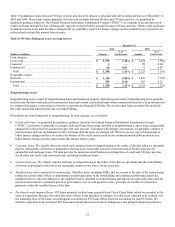
We evaluate available-for-sale securities in an unrealized loss position as of the end of each quarter for other-than-temporary
impairment based on a number of criteria, including the extent and duration of the decline in value, the severity and duration of the
impairment, recent events specific to the issuer and/or industry to which the issuer belongs, the payment structure of the security,
external credit ratings and the failure of the issuer to make scheduled interest or principal payments, the value of underlying collateral,
our intent and ability to hold the security and current market conditions.
Other-than-temporary impairment is recognized in earnings if one of the following conditions exists: (1) a decision to sell the security
has been made; (2) it is more likely than not that we will be required to sell the security before the impairment is recovered; or (3) the
amortized cost basis is not expected to be recovered. If, however, we have not made a decision to sell the security and we do not
expect that we will be required to sell prior to recovery of the amortized cost basis, only the credit component of other-than-temporary
impairment is recognized in earnings. The noncredit component is recorded in AOCI. The credit component is the difference between
the security’s amortized cost basis and the present value of its expected future cash flows discounted based on the original yield, while
the noncredit component is the remaining difference between the security’s fair value and amortized cost.
We recognized net OTTI on debt securities of $65 million, $32 million and $11 million for the years ended December 31, 2010, 2009 and
2008, respectively, due in part to deterioration in the credit performance of certain securities resulting from the continued weaknesses in
the housing market, high unemployment, and our decision to sell certain other securities before recovery of the impairment amount.