Capital One 2010 Annual Report Download - page 42
Download and view the complete annual report
Please find page 42 of the 2010 Capital One annual report below. You can navigate through the pages in the report by either clicking on the pages listed below, or by using the keyword search tool below to find specific information within the annual report.-
 1
1 -
2
-
3
-
4
-
5
-
6
-
7
-
8
-
9
-
10
-
11
-
12
-
13
-
14
-
15
-
16
-
17
-
18
-
19
-
20
-
21
-
22
-
23
-
24
-
25
-
26
-
27
-
28
-
29
-
30
-
31
-
 32
32 -
 33
33 -
 34
34 -
 35
35 -
 36
36 -
 37
37 -
 38
38 -
 39
39 -
 40
40 -
 41
41 -
 42
42 -
 43
43 -
 44
44 -
 45
45 -
 46
46 -
 47
47 -
 48
48 -
 49
49 -
 50
50 -
 51
51 -
 52
52 -
53
-
54
-
55
-
56
-
57
-
58
-
59
-
60
-
61
-
62
-
63
-
64
-
65
-
66
-
67
-
68
-
69
-
70
-
71
-
72
-
73
-
74
-
75
-
76
-
77
-
78
-
79
-
80
-
81
-
82
-
83
-
84
-
85
-
86
-
87
-
88
-
89
-
90
-
91
-
92
-
93
-
94
-
95
-
96
-
97
-
98
-
99
-
100
-
101
-
102
-
103
-
104
-
105
-
106
-
107
-
108
-
109
-
110
-
111
-
112
-
113
-
114
-
115
-
116
-
117
-
118
-
119
-
120
-
121
-
122
-
123
-
124
-
125
-
126
-
127
-
128
-
129
-
130
-
131
-
132
-
133
-
134
-
135
-
136
-
137
-
138
-
139
-
140
-
141
-
142
-
143
-
144
-
145
-
146
-
147
-
148
-
149
-
150
-
151
-
152
-
153
-
154
-
155
-
156
-
157
-
158
-
159
-
160
-
161
-
162
-
163
-
164
-
165
-
166
-
167
-
168
-
169
-
170
-
171
-
172
-
173
-
174
-
175
-
176
-
177
-
178
-
179
-
180
-
181
-
182
-
183
-
184
-
185
-
186
-
187
-
188
-
189
-
190
-
191
-
192
-
193
-
194
-
195
-
196
-
197
-
198
-
199
-
200
-
201
-
202
-
203
-
204
-
205
-
206
-
207
-
208
-
209
-
210
-
211
-
212
-
213
-
214
-
215
-
216
-
217
-
218
-
219
-
220
-
221
-
222
-
223
-
224
-
225
-
226
 |
 |
22
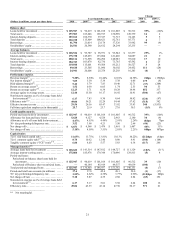
(1) Effective February 27, 2009, we acquired Chevy Chase Bank. Our financial results subsequent to February 27, 2009 include the operations of
Chevy Chase Bank. While our 2010 results include the full year impact of the Chevy Chase Bank acquisition, our 2009 results include on a
partial year impact.
(2) On December 1, 2006, we acquired 100% of the outstanding common stock of North Fork Bancorporation (“North Fork”) for total consideration
of $13.2 billion. Our financial results subsequent to December 1, 2006 include the operations of North Fork.
(3) Non-interest expense for 2008 includes goodwill impairment of $811 million related to the auto division of our Consumer Banking business.
(4) Discontinued operations reflect ongoing costs related to the mortgage origination operations of Greenpoint; wholesale mortgage banking unit,
which we closed in 2007.
(5) Preferred stock dividends in 2009 and 2008 were attributable to our participation in the U.S. Department of Treasury’s Troubled Asset Relief
Program (“TARP program”). See “Note 12—Stockholders’ Equity” for additional information.
(6) Calculated based on total revenue for the period divided by average interest-earning assets for the period.
(7) Calculated based on net interest income for the period divided by average interest-earning assets for the period.
(8) Calculated based on total revenue less net charge-offs for the period divided by average interest-earning assets for the period.
(9) Calculated based on income from continuing operations, net of tax, for the period divided by average total assets for the period.
(10) Calculated based on income from continuing operations, net of tax, for the period divided by average stockholders’ equity.
(11) Calculated based on non-interest expense, excluding restructuring and goodwill impairment charges, for the period divided by average loans
held for investment for the period.
(12) Calculated based on non-interest expense, excluding restructuring and goodwill impairment charges, for the period divided by total revenue for
the period.
(13) Tier 1 common equity ratio is a non-GAAP measure calculated based on Tier 1 common equity divided by risk-weighted assets. See “Exhibit
99.1” for the calculation components. Also see “MD&A—Liquidity and Capital Management—Capital” for additional information.
(14) TCE ratio is a non-GAAP measure calculated based on tangible common equity divided by tangible assets. See “Exhibit 99.1” for the
calculation components.
(15) See “MD&A—Supplemental Statistical Tables” in this report and “Exhibit 99.1” for a reconciliation of non-GAAP managed measures to
comparable U.S.GAAP measures.