Capital One 2010 Annual Report Download - page 83
Download and view the complete annual report
Please find page 83 of the 2010 Capital One annual report below. You can navigate through the pages in the report by either clicking on the pages listed below, or by using the keyword search tool below to find specific information within the annual report.-
 1
1 -
2
-
3
-
4
-
5
-
6
-
7
-
8
-
9
-
10
-
11
-
12
-
13
-
14
-
15
-
16
-
17
-
18
-
19
-
20
-
21
-
22
-
23
-
24
-
25
-
26
-
27
-
28
-
29
-
30
-
31
-
32
-
33
-
34
-
35
-
36
-
37
-
38
-
39
-
40
-
41
-
42
-
43
-
44
-
45
-
46
-
47
-
48
-
49
-
50
-
51
-
52
-
53
-
54
-
55
-
56
-
57
-
58
-
59
-
60
-
61
-
62
-
63
-
64
-
65
-
66
-
67
-
68
-
69
-
70
-
71
-
72
-
 73
73 -
 74
74 -
 75
75 -
 76
76 -
 77
77 -
 78
78 -
 79
79 -
 80
80 -
 81
81 -
 82
82 -
 83
83 -
 84
84 -
 85
85 -
 86
86 -
 87
87 -
 88
88 -
 89
89 -
 90
90 -
 91
91 -
 92
92 -
 93
93 -
94
-
95
-
96
-
97
-
98
-
99
-
100
-
101
-
102
-
103
-
104
-
105
-
106
-
107
-
108
-
109
-
110
-
111
-
112
-
113
-
114
-
115
-
116
-
117
-
118
-
119
-
120
-
121
-
122
-
123
-
124
-
125
-
126
-
127
-
128
-
129
-
130
-
131
-
132
-
133
-
134
-
135
-
136
-
137
-
138
-
139
-
140
-
141
-
142
-
143
-
144
-
145
-
146
-
147
-
148
-
149
-
150
-
151
-
152
-
153
-
154
-
155
-
156
-
157
-
158
-
159
-
160
-
161
-
162
-
163
-
164
-
165
-
166
-
167
-
168
-
169
-
170
-
171
-
172
-
173
-
174
-
175
-
176
-
177
-
178
-
179
-
180
-
181
-
182
-
183
-
184
-
185
-
186
-
187
-
188
-
189
-
190
-
191
-
192
-
193
-
194
-
195
-
196
-
197
-
198
-
199
-
200
-
201
-
202
-
203
-
204
-
205
-
206
-
207
-
208
-
209
-
210
-
211
-
212
-
213
-
214
-
215
-
216
-
217
-
218
-
219
-
220
-
221
-
222
-
223
-
224
-
225
-
226
 |
 |
63
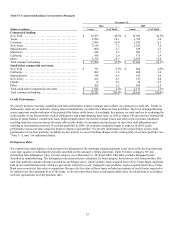
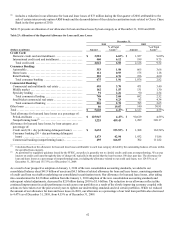
Deposits
Our deposits have become our largest source of funding for our operations and asset growth. Total deposits increased by $6.4 billion,
or 5.5%, in 2010, to $122.2 billion as of December 31, 2010 from $115.8 billion as of December 31, 2009. The increase in deposits
was primarily driven by increases of $9.1 billion, $6.4 billion, and $1.6 billion in savings accounts, money market deposits, and non-
interest bearing deposits, respectively, which was partially offset by a decrease of $9.7 billion in other consumer time deposits and
$1.9 billion in certificates of deposit of $100,000 or more, reflecting our shift to more relationship driven, lower cost liquid savings
and transaction accounts. We provide additional information on deposits, including the composition of our deposits, average
outstanding balances, interest expense and yield, below in “Liquidity and Funding.”
Senior and Subordinated Notes and Other Borrowings
Senior and subordinated notes and other borrowings decreased to $14.9 billion as of December 31, 2010, from $17.1 billion as of
December 31, 2009. The decrease was primarily attributable to a reduction in Federal Home Loan Bank (“FHLB”) advances. Because
of the decrease in our loan portfolio and the increase in deposits during 2010, our funding needs were lower and we reduced our level
of borrowings. We provide additional information on our borrowings in “Note 10—Deposits and Borrowings.”
Securitized Debt Obligations
Borrowings owed to securitization investors, after taking into consideration the addition of $44.3 billion of debt issued to third-party
investors by securitization trusts that we were required to consolidate on January 1, 2010, as a result of the adoption of the new
consolidation accounting standards, decreased by $21.4 billion to $26.9 billion as of December 31, 2010, from $48.3 billion as of
January 1, 2010. This decrease was attributable to pay downs and charge-offs of the loans underlying the securitization trusts and
maturities.
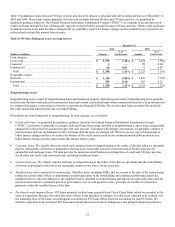
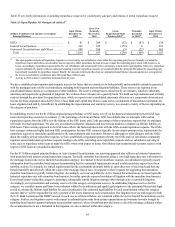
Potential Mortgage Representation & Warranty Liabilities
In recent years, we acquired three subsidiaries that originated residential mortgage loans and sold them to various purchasers,
including purchasers who created securitization trusts. These subsidiaries are Capital One Home Loans, which was acquired in
February 2005; GreenPoint Mortgage Funding, Inc. (“GreenPoint”), which was acquired in December 2006 as part of the North Fork
acquisition; and Chevy Chase Bank, which was acquired in February 2009 and subsequently merged into CONA.
In connection with their sales of mortgage loans, the subsidiaries entered into agreements containing varying representations and
warranties about, among other things, the ownership of the loan, the validity of the lien securing the loan, the loan’s compliance with
any applicable loan criteria established by the purchaser, including underwriting guidelines and the ongoing existence of mortgage
insurance, and the loan’s compliance with applicable federal, state and local laws. The representations and warranties do not address
the credit performance of the mortgage loans, but mortgage loan performance often influences whether a claim for breach of
representation and warranty will be asserted and has an effect on the amount of any loss in the event of a breach of a representation or
warranty.
Each of these subsidiaries may be required to repurchase mortgage loans in the event of certain breaches of these representations and
warranties. In the event of a repurchase, the subsidiary is typically required to pay the then unpaid principal balance of the loan
together with interest and certain expenses (including, in certain cases, legal costs incurred by the purchaser and/or others). The
subsidiary then recovers the loan or, if the loan has been foreclosed, the underlying collateral. The subsidiary is exposed to any losses
on the repurchased loans after giving effect to any recoveries on the collateral. In some instances, rather than repurchase the loans, a
subsidiary may agree to make a cash payment to make an investor whole on losses or to settle repurchase claims. In addition, our
subsidiaries may be required to indemnify certain purchasers and others against losses they incur as a result of certain breaches of
representations and warranties. In some cases, the amount of such losses could exceed the repurchase amount of the related loans.
These subsidiaries, in total, originated and sold to non-affiliates approximately $111 billion original principal balance of mortgage
loans between 2005 and 2008, which are the years (or “vintages”) with respect to which our subsidiaries have received the vast
majority of the repurchase requests and other related claims.