Capital One 2010 Annual Report Download - page 81
Download and view the complete annual report
Please find page 81 of the 2010 Capital One annual report below. You can navigate through the pages in the report by either clicking on the pages listed below, or by using the keyword search tool below to find specific information within the annual report.-
 1
1 -
2
-
3
-
4
-
5
-
6
-
7
-
8
-
9
-
10
-
11
-
12
-
13
-
14
-
15
-
16
-
17
-
18
-
19
-
20
-
21
-
22
-
23
-
24
-
25
-
26
-
27
-
28
-
29
-
30
-
31
-
32
-
33
-
34
-
35
-
36
-
37
-
38
-
39
-
40
-
41
-
42
-
43
-
44
-
45
-
46
-
47
-
48
-
49
-
50
-
51
-
52
-
53
-
54
-
55
-
56
-
57
-
58
-
59
-
60
-
61
-
62
-
63
-
64
-
65
-
66
-
67
-
68
-
69
-
70
-
 71
71 -
 72
72 -
 73
73 -
 74
74 -
 75
75 -
 76
76 -
 77
77 -
 78
78 -
 79
79 -
 80
80 -
 81
81 -
 82
82 -
 83
83 -
 84
84 -
 85
85 -
 86
86 -
 87
87 -
 88
88 -
 89
89 -
 90
90 -
 91
91 -
92
-
93
-
94
-
95
-
96
-
97
-
98
-
99
-
100
-
101
-
102
-
103
-
104
-
105
-
106
-
107
-
108
-
109
-
110
-
111
-
112
-
113
-
114
-
115
-
116
-
117
-
118
-
119
-
120
-
121
-
122
-
123
-
124
-
125
-
126
-
127
-
128
-
129
-
130
-
131
-
132
-
133
-
134
-
135
-
136
-
137
-
138
-
139
-
140
-
141
-
142
-
143
-
144
-
145
-
146
-
147
-
148
-
149
-
150
-
151
-
152
-
153
-
154
-
155
-
156
-
157
-
158
-
159
-
160
-
161
-
162
-
163
-
164
-
165
-
166
-
167
-
168
-
169
-
170
-
171
-
172
-
173
-
174
-
175
-
176
-
177
-
178
-
179
-
180
-
181
-
182
-
183
-
184
-
185
-
186
-
187
-
188
-
189
-
190
-
191
-
192
-
193
-
194
-
195
-
196
-
197
-
198
-
199
-
200
-
201
-
202
-
203
-
204
-
205
-
206
-
207
-
208
-
209
-
210
-
211
-
212
-
213
-
214
-
215
-
216
-
217
-
218
-
219
-
220
-
221
-
222
-
223
-
224
-
225
-
226
 |
 |

61
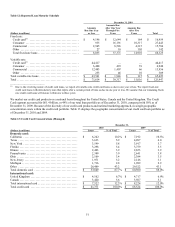
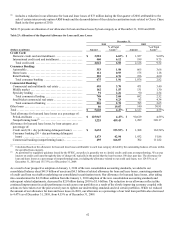
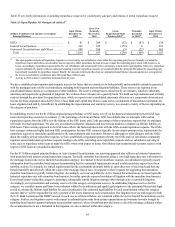
Table 22: Summary of Reported Allowance for Loan and Lease Losses
December 31,
(Dollars in millions) 2010 2009 2008
Balance at beginning of period, as reported ............................................... $ 4,127 $ 4,524 $ 2,963
Impact from January 1, 2010 adoption of new consolidation accounting standards ............... 4,317(1)
—
—
Balance at beginning of period, as adjusted ............................................... $ 8,444 $ 4,524 $ 2,963
Provision for loan and lease losses ...................................................... 3,907 4,230 5,101
Charge-offs:
Credit Card business:
Domestic credit card and installment ................................................ (6,020) (3,050) (2,244)
International credit card and installment ............................................. (761) (284) (255)
Total credit card ............................................................... (6,781) (3,334) (2,499)
Consumer Banking business:
Automobile ..................................................................... (672) (1,110) (1,236)
Home loans ..................................................................... (97) (87) (38)
Retail banking .................................................................. (129) (160) (122)
Total consumer banking ........................................................ (898) (1,357) (1,396)
Commercial Banking business:
Commercial and multifamily real estate .............................................. (207) (208) (47)
Middle market .................................................................. (101) (53) (22)
Specialty lending ................................................................ (36) (49) (10)
Total commercial lending ....................................................... (344) (310) (79)
Small-ticket commercial real estate ................................................. (100) (134) (8)
Total commercial banking ....................................................... (444) (444) (87)
Other loans ....................................................................... (115) (207) (169)
Total charge-offs .................................................................... (8,238) (5,342) (4,151)
Recoveries:
Credit Card business:
Domestic credit card and installment ................................................ 1,113 447 425
International credit card and installment ............................................. 169 52 65
Total credit card ............................................................... 1,282 499 490
Consumer Banking business:
Automobile ..................................................................... 215 238 158
Home loans ..................................................................... 4 3 1
Retail banking .................................................................. 24 22 19
Total consumer banking ........................................................ 243 263 178
Commercial Banking business:
Commercial and multifamily real estate .............................................. 20 2 1
Middle market .................................................................. 24 3 2
Specialty lending ................................................................ 8 3 1
Total commercial lending ....................................................... 52 8 4
Small-ticket commercial real estate ................................................. 2 2
—
Total commercial banking ....................................................... 54 10 4
Other loans ....................................................................... 8 2 1
Total recoveries ..................................................................... 1,587 774 673
N
et charge-offs ...................................................................... (6,651) (4,568) (3,478)
Impact from acquisitions, sales and other changes
(
2
)
........................................ (72) (59) (62)
Balance at end of period .............................................................. $ 5,628 $ 4,127 $ 4,524
Allowance for loan and lease losses as a percentage of loans held for investment ................ 4.47% 4.55% 4.48%
Allowance for loan and lease losses by geographic distribution:
Domestic ......................................................................... $ 5,168 $ 3,928 $ 4,331
International ...................................................................... 460 199 193
Total allowance for loan and lease losses ................................................. $ 5,628 $ 4,127 $ 4,524
Allowance for loan and lease losses by loan category:
Domestic card ..................................................................... $ 3,581 $ 1,927 $ 2,544
International card .................................................................. 460 199 193
Consumer banking ................................................................. 675 1,076 1,314
Commercial banking ............................................................... 826 785 301
Other ............................................................................ 86 140 172
Allowance for loan and lease losses ..................................................... $ 5,628 $ 4,127 $ 4,524
________________________
(1) Includes an adjustment of $53 million made in the second quarter of 2010 for the impact as of January 1, 2010 of impairment on consolidated
loans accounted for as TDRs.