Capital One 2010 Annual Report Download - page 133
Download and view the complete annual report
Please find page 133 of the 2010 Capital One annual report below. You can navigate through the pages in the report by either clicking on the pages listed below, or by using the keyword search tool below to find specific information within the annual report.-
 1
1 -
2
-
3
-
4
-
5
-
6
-
7
-
8
-
9
-
10
-
11
-
12
-
13
-
14
-
15
-
16
-
17
-
18
-
19
-
20
-
21
-
22
-
23
-
24
-
25
-
26
-
27
-
28
-
29
-
30
-
31
-
32
-
33
-
34
-
35
-
36
-
37
-
38
-
39
-
40
-
41
-
42
-
43
-
44
-
45
-
46
-
47
-
48
-
49
-
50
-
51
-
52
-
53
-
54
-
55
-
56
-
57
-
58
-
59
-
60
-
61
-
62
-
63
-
64
-
65
-
66
-
67
-
68
-
69
-
70
-
71
-
72
-
73
-
74
-
75
-
76
-
77
-
78
-
79
-
80
-
81
-
82
-
83
-
84
-
85
-
86
-
87
-
88
-
89
-
90
-
91
-
92
-
93
-
94
-
95
-
96
-
97
-
98
-
99
-
100
-
101
-
102
-
103
-
104
-
105
-
106
-
107
-
108
-
109
-
110
-
111
-
112
-
113
-
114
-
115
-
116
-
117
-
118
-
119
-
120
-
121
-
122
-
 123
123 -
 124
124 -
 125
125 -
 126
126 -
 127
127 -
 128
128 -
 129
129 -
 130
130 -
 131
131 -
 132
132 -
 133
133 -
 134
134 -
 135
135 -
 136
136 -
 137
137 -
 138
138 -
 139
139 -
 140
140 -
 141
141 -
 142
142 -
 143
143 -
144
-
145
-
146
-
147
-
148
-
149
-
150
-
151
-
152
-
153
-
154
-
155
-
156
-
157
-
158
-
159
-
160
-
161
-
162
-
163
-
164
-
165
-
166
-
167
-
168
-
169
-
170
-
171
-
172
-
173
-
174
-
175
-
176
-
177
-
178
-
179
-
180
-
181
-
182
-
183
-
184
-
185
-
186
-
187
-
188
-
189
-
190
-
191
-
192
-
193
-
194
-
195
-
196
-
197
-
198
-
199
-
200
-
201
-
202
-
203
-
204
-
205
-
206
-
207
-
208
-
209
-
210
-
211
-
212
-
213
-
214
-
215
-
216
-
217
-
218
-
219
-
220
-
221
-
222
-
223
-
224
-
225
-
226
 |
 |

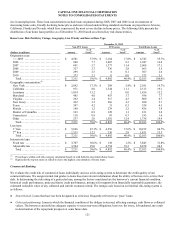
CAPITAL ONE FINANCIAL CORPORATION
NOTES TO CONSOLIDATED STATEMENTS
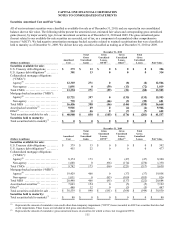
113
December 31, 2009
Less than 12 Months 12 Months or Longer Total
(Dollars in millions) Fair Value
Gross
Unrealized
Losses Fair Value
Gross
Unrealized
Losses Fair Value
Gross
Unrealized
Losses
Securities available for sale:
U.S. Treasury debt obligations ........ $ 0 $ 0 $ 0 $ 0 $ 0 $ 0
U.S. Agency debt obligations(1) ........ 27 0 0 0 27 0
CMOs: ..............................
Agency(2) .......................... 2,188 (38) 689 (9) 2,877 (47)
Non-agency ....................... 3 (1) 1,313 (269) 1,316 (270)
Total CMOs ......................... 2,191 (39) 2,002 (278) 4,193 (317)
MBS:
Agency(2) .......................... 2,520 (30) 325 (7) 2,845 (37)
Non-agency ....................... 0 0 810 (185) 810 (185)
Total MBS .......................... 2,520 (30) 1,135 (192) 3,655 (222)
Asset-backed securities ............... 490 (1) 56 (4) 546 (5)
Other ............................... 30 0 115 (5) 145 (5)
Total securities available for sale in a
gross unrealized loss position ....... $ 5,258 $ (70) $ 3,308 $ (479) $ 8,566 $ (549)
________________________
(1) Consists of debt securities issued by Fannie Mae and Freddie Mac.
(2) Consists of mortgage-related securities issued by Fannie Mae, Freddie Mac and Ginnie Mae.
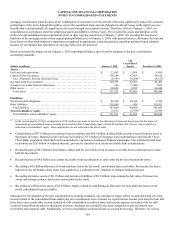
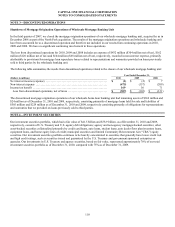
The gross unrealized losses on our available-for-sale securities of $281 million as of December 31, 2010 relate to approximately 340
individual securities. Our investments in non-agency CMOs, non-agency residential MBS and asset-backed securities accounted for
$131 million, or 47%, of total gross unrealized losses as of December 31, 2010. Of the $281 million gross unrealized losses as of
December 31, 2010, $137 million related to securities that had been in a loss position for more than 12 months. As discussed in more
detail below, we conduct periodic reviews of all securities with unrealized losses to assess whether the impairment is other-than-
temporary. Based on our assessments, we have recorded OTTI for a portion of our non-agency CMO, non-agency residential MBS
and asset-backed securities, which is discussed in more detail later in this footnote.
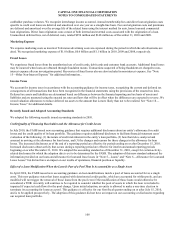
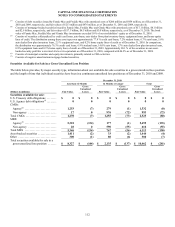
Maturities and Yields of Securities Available for Sale
The following table summarizes the remaining scheduled contractual maturities, assuming no prepayments, of our investment
securities as of December 31, 2010.
December 31, 2010
(Dollars in millions)
Amortized
Cost Fair Value
Due in 1 year or less .......................................................................
.
$ 2,963 $ 2,980
Due after 1 year through 5 years ............................................................
.
7,127 7,198
Due after 5 years through 10 years ..........................................................
.
1,100 1,129
Due after 10 years(1) .......................................................................
.
29,798 30,230
Total ...................................................................................
.
$ 40,988 $ 41,537
________________________
(1) Investments with no stated maturities, which consist of equity securities, are included with contractual maturities due after 10 years.