Capital One 2010 Annual Report Download - page 199
Download and view the complete annual report
Please find page 199 of the 2010 Capital One annual report below. You can navigate through the pages in the report by either clicking on the pages listed below, or by using the keyword search tool below to find specific information within the annual report.-
 1
1 -
2
-
3
-
4
-
5
-
6
-
7
-
8
-
9
-
10
-
11
-
12
-
13
-
14
-
15
-
16
-
17
-
18
-
19
-
20
-
21
-
22
-
23
-
24
-
25
-
26
-
27
-
28
-
29
-
30
-
31
-
32
-
33
-
34
-
35
-
36
-
37
-
38
-
39
-
40
-
41
-
42
-
43
-
44
-
45
-
46
-
47
-
48
-
49
-
50
-
51
-
52
-
53
-
54
-
55
-
56
-
57
-
58
-
59
-
60
-
61
-
62
-
63
-
64
-
65
-
66
-
67
-
68
-
69
-
70
-
71
-
72
-
73
-
74
-
75
-
76
-
77
-
78
-
79
-
80
-
81
-
82
-
83
-
84
-
85
-
86
-
87
-
88
-
89
-
90
-
91
-
92
-
93
-
94
-
95
-
96
-
97
-
98
-
99
-
100
-
101
-
102
-
103
-
104
-
105
-
106
-
107
-
108
-
109
-
110
-
111
-
112
-
113
-
114
-
115
-
116
-
117
-
118
-
119
-
120
-
121
-
122
-
123
-
124
-
125
-
126
-
127
-
128
-
129
-
130
-
131
-
132
-
133
-
134
-
135
-
136
-
137
-
138
-
139
-
140
-
141
-
142
-
143
-
144
-
145
-
146
-
147
-
148
-
149
-
150
-
151
-
152
-
153
-
154
-
155
-
156
-
157
-
158
-
159
-
160
-
161
-
162
-
163
-
164
-
165
-
166
-
167
-
168
-
169
-
170
-
171
-
172
-
173
-
174
-
175
-
176
-
177
-
178
-
179
-
180
-
181
-
182
-
183
-
184
-
185
-
186
-
187
-
188
-
 189
189 -
 190
190 -
 191
191 -
 192
192 -
 193
193 -
 194
194 -
 195
195 -
 196
196 -
 197
197 -
 198
198 -
 199
199 -
 200
200 -
 201
201 -
 202
202 -
 203
203 -
 204
204 -
 205
205 -
 206
206 -
 207
207 -
 208
208 -
 209
209 -
210
-
211
-
212
-
213
-
214
-
215
-
216
-
217
-
218
-
219
-
220
-
221
-
222
-
223
-
224
-
225
-
226
 |
 |

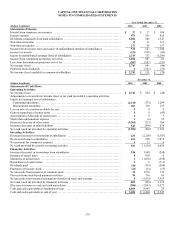
CAPITAL ONE FINANCIAL CORPORATION
NOTES TO CONSOLIDATED STATEMENTS
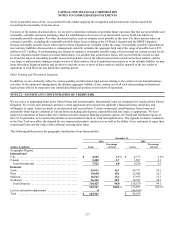
179
Year Ended December 31,
(Dollars in millions) 2010 2009 2008
Statements of Income
Interest from temporary investments ...................................................... $ 27 $ 37 $ 184
Interest expense ......................................................................... 479 336 425
Dividends, principally from bank subsidiaries .............................................. 1,200 500 1,547
N
on-interest income ..................................................................... 35 32 111
N
on-interest expense ..................................................................... 273 90 137
Income before income taxes and equity in undistributed earnings of subsidiaries .............. 510 143 1,280
Income tax benefit ....................................................................... (221) (109) (94)
Equity in undistributed earnings (loss) of subsidiaries ....................................... 2,319 735 (1,289)
Income from continuing operations, net of tax .............................................. 3,050 987 85
Loss from discontinued operations, net of tax .............................................. (307) (103) (131)
N
et income (loss) ........................................................................ 2,743 884 (46)
Preferred stock dividends ................................................................. 0 (564) (33)
N
et income (loss) available to common stockholders ....................................... $ 2,743 $ 320 $ (79)
December 31,
(Dollars in millions) 2010 2009 2008
Statements of Cash Flows
Operating Activities:
N
et income (loss) ........................................................................ $ 2,743 $ 884 $ (46)
Adjustments to reconcile net income (loss) to net cash provided by operating activities:
Equity in (earnings) loss of subsidiaries:
Continuing operations .................................................................. (2,319) (735) 1,289
Discontinued operations ................................................................ 307 103 131
Loss on sale of securities available for sale ................................................. 0 0 9
Gain on repurchase of senior notes ........................................................ 0 0 (43)
Amortization of discount of senior notes ................................................... 0 0 3
Stock plan compensation expense ......................................................... 3 (6) 59
(Increase) decrease in other assets ......................................................... (3,261) (115) 106
Increase (decrease) in other liabilities ..................................................... 543 (399) 674
N
et cash (used in) provided by operating activities ......................................... (1,984) (268) 2,182
Investing Activities:
Decrease (increase) in investment in subsidiaries ........................................... 433 (2,250) (1,385)
Decrease in loans to subsidiaries .......................................................... 164 689 5,415
N
et payment for companies acquire
d
...................................................... 0 31 0
N
et cash provided by (used in) investing activities .......................................... 597 (1,530) 4,030
Financing Activities:
Increase (decrease) in borrowings from subsidiaries ........................................ 390 1,988 (268)
Issuance of senior notes .................................................................. 0 995 0
Maturities of senior notes ................................................................ 0 (1,030) (550)
Repurchases of senior notes .............................................................. 0 0 (713)
Dividends paid .......................................................................... (91) (319) (568)
Purchases of treasury stock ............................................................... (22) (14) (13)
N
et proceeds from issuances of common stock ............................................. 30 1,536 772
Proceeds from stock-based payment activities .............................................. 96 116 95
N
et proceeds from issuance/redemption of preferred stock and warrants ...................... 0 (3,555) 3,555
N
et cash (used in) provided by financing activities ......................................... 403 (283) 2,310
(Decrease) increase in cash and cash equivalents ........................................... (984) (2,081) 8,522
Cash and cash equivalents at beginning of year ............................................. 6,466 8,547 25
Cash and cash equivalents at end of year ................................................... $ 5,482 $ 6,466 $ 8,547