Capital One 2010 Annual Report Download - page 114
Download and view the complete annual report
Please find page 114 of the 2010 Capital One annual report below. You can navigate through the pages in the report by either clicking on the pages listed below, or by using the keyword search tool below to find specific information within the annual report.-
 1
1 -
2
-
3
-
4
-
5
-
6
-
7
-
8
-
9
-
10
-
11
-
12
-
13
-
14
-
15
-
16
-
17
-
18
-
19
-
20
-
21
-
22
-
23
-
24
-
25
-
26
-
27
-
28
-
29
-
30
-
31
-
32
-
33
-
34
-
35
-
36
-
37
-
38
-
39
-
40
-
41
-
42
-
43
-
44
-
45
-
46
-
47
-
48
-
49
-
50
-
51
-
52
-
53
-
54
-
55
-
56
-
57
-
58
-
59
-
60
-
61
-
62
-
63
-
64
-
65
-
66
-
67
-
68
-
69
-
70
-
71
-
72
-
73
-
74
-
75
-
76
-
77
-
78
-
79
-
80
-
81
-
82
-
83
-
84
-
85
-
86
-
87
-
88
-
89
-
90
-
91
-
92
-
93
-
94
-
95
-
96
-
97
-
98
-
99
-
100
-
101
-
102
-
103
-
 104
104 -
 105
105 -
 106
106 -
 107
107 -
 108
108 -
 109
109 -
 110
110 -
 111
111 -
 112
112 -
 113
113 -
 114
114 -
 115
115 -
 116
116 -
 117
117 -
 118
118 -
 119
119 -
 120
120 -
 121
121 -
 122
122 -
 123
123 -
 124
124 -
125
-
126
-
127
-
128
-
129
-
130
-
131
-
132
-
133
-
134
-
135
-
136
-
137
-
138
-
139
-
140
-
141
-
142
-
143
-
144
-
145
-
146
-
147
-
148
-
149
-
150
-
151
-
152
-
153
-
154
-
155
-
156
-
157
-
158
-
159
-
160
-
161
-
162
-
163
-
164
-
165
-
166
-
167
-
168
-
169
-
170
-
171
-
172
-
173
-
174
-
175
-
176
-
177
-
178
-
179
-
180
-
181
-
182
-
183
-
184
-
185
-
186
-
187
-
188
-
189
-
190
-
191
-
192
-
193
-
194
-
195
-
196
-
197
-
198
-
199
-
200
-
201
-
202
-
203
-
204
-
205
-
206
-
207
-
208
-
209
-
210
-
211
-
212
-
213
-
214
-
215
-
216
-
217
-
218
-
219
-
220
-
221
-
222
-
223
-
224
-
225
-
226
 |
 |

94
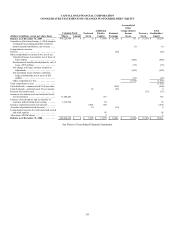
CAPITAL ONE FINANCIAL CORPORATION
CONSOLIDATED STATEMENTS OF CASH FLOWS
Year Ended December 31,
(Dollars in millions) 2010 2009 2008
Operating activities:
Income from continuing operations, net of tax .............................................................. $ 3,050 $ 987 $ 85
Loss from discontinued operations, net of tax ............................................................... (307) (103) (131)
N
et income (loss) .......................................................................................... 2,743 884 (46)
Adjustments to reconcile net income to cash provided by operating activities:
Provision for loan and lease losses ....................................................................... 3,907 4,230 5,101
Depreciation and amortization, net ....................................................................... 582 683 692
Net gains on sales of securities available for sale . . . . . . . . . . . . . . . . . . . . . . . . . . . . . . . . . . . . . . . . . . . . . . . . . . . . . . . . . (141) (218) (14)
Goodwill impairment ................................................................................... 0 0 811
Gains on sales of auto loans ............................................................................. (2)
Gains on extinguishment/repurchase of debt/senior notes . . . . . . . . . . . . . . . . . . . . . . . . . . . . . . . . . . . . . . . . . . . . . . . . . 0 0 (54)
Net gains on deconsolidation ............................................................................ (177) 0 0
Loans held for sale:
Transfers in and originations .......................................................................... (180) (1,194) (1,949)
(Gains) losses on sales ................................................................................ (1) 0 (31)
Proceeds from sales .................................................................................. 241 1,228 2,211
Stock plan compensation expense ........................................................................ 149 146 112
Changes in assets and liabilities, net of effects from purchase of companies acquired and the effect of new
accounting standards:
(Increase) decrease in interest receivable .............................................................. (137) (108) 11
(Increase) decrease in accounts receivable from securitizations(1) ....................................... (475) (2,015) (1,625)
(Increase) decrease in other assets(1) ................................................................... 1,432 339 (3,108)
Increase (decrease) in interest payable ................................................................. (21) (167) 45
Increase (decrease) in other liabilities(1) ................................................................ (133) (1,709) 1,203
Net cash provided by (used in) operating activities attributable to discontinued operations . . . . . . . . . . . . . . . . . . 353 (17) 126
Net cash provided by operating activities ................................................................. 8,142 2,082 3,483
Investing activities:
Increase in restricted cash for securitization investors(1) ...................................................... 2,897 727 0
Purchases of securities available for sale .................................................................... (26,378) (27,827) (21,698)
Proceeds from paydowns and maturities of securities available for sale . . . . . . . . . . . . . . . . . . . . . . . . . . . . . . . . . . . . . . . 11,567 9,541 6,676
Proceeds from sales of securities available for sale . . . . . . . . . . . . . . . . . . . . . . . . . . . . . . . . . . . . . . . . . . . . . . . . . . . . . . . . . . 12,466 13,410 2,628
Proceeds from securitizations of loans ...................................................................... 0 12,068 10,047
Proceeds from sale of interest-only bonds ................................................................... 57 0 0
N
et (increase) decrease in loans held for investmen
t
(1) ....................................................... 2,607 1,934 (13,588)
Principal recoveries of loans previously charged off . . . . . . . . . . . . . . . . . . . . . . . . . . . . . . . . . . . . . . . . . . . . . . . . . . . . . . . . . 1,587 774 673
Additions of premises and equipment ....................................................................... (340) (243) (356)
N
et cash provided by companies acquired .................................................................. 0 778 0
N
et cash provided by investing activities attributable to discontinued operations . . . . . . . . . . . . . . . . . . . . . . . . . . . . . . 0 0 12
Other decrease in investing activities ....................................................................... 0 0 (3)
Net cash provided by (used in) investing activities . . . . . . . . . . . . . . . . . . . . . . . . . . . . . . . . . . . . . . . . . . . . . . . . . . . . . . . . 4,463 11,162 (15,609)
Financing activities:
N
et increase (decrease) in deposits ......................................................................... 6,401 (6,369) 25,860
N
et decrease in securitized debt obligations ................................................................. (21,385) (3,557) (5,557)
N
et decrease in other borrowings(1) ......................................................................... (293) (2,356) (6,373)
Maturities of senior notes .................................................................................. (666) (1,447) (1,802)
Repurchase of senior notes ................................................................................. 0 0 (1,121)
Redemptions of acquired debt and noncontrolling interests . . . . . . . . . . . . . . . . . . . . . . . . . . . . . . . . . . . . . . . . . . . . . . . . . . 0 (464) 0
Issuance of senior and subordinated notes and junior subordinated debentures . . . . . . . . . . . . . . . . . . . . . . . . . . . . . . . . 0 4,500 0
Purchases of treasury stock ................................................................................. (22) (14) (13)
Dividends paid on common stock .......................................................................... (91) (214) (568)
Dividends paid on preferred stock .......................................................................... 0 (105) 0
N
et proceeds from issuances of common stock .............................................................. 30 1,536 772
N
et (payments)/proceeds from issuance/(redemption) of preferred stock and warrants . . . . . . . . . . . . . . . . . . . . . . . . 0 (3,555) 3,555
Proceeds from share-based payment activities ............................................................... 3 (6) 59
N
et cash provided by (used in) financing activities attributable to discontinued operations . . . . . . . . . . . . . . . . . . . . (18) 1 (16)
Net cash provided by (used in) financing activities . . . . . . . . . . . . . . . . . . . . . . . . . . . . . . . . . . . . . . . . . . . . . . . . . . . . . . . (16,041) (12,050) 14,796
Increase in cash and cash equivalents .................................................................... (3,436) 1,194 2,670
Cash and cash equivalents at beginning of the period . . . . . . . . . . . . . . . . . . . . . . . . . . . . . . . . . . . . . . . . . . . . . . . . . . . . . . . . 8,685 7,491 4,821
Cash and cash equivalents at end of the period .............................................................. $ 5,249 $ 8,685 $ 7,491
Supplemental cash flow information: .....................................................................
Non-cash items:
Cumulative effect from adoption of new consolidation accounting standards . . . . . . . . . . . . . . . . . . . . . . . . . . . . . . . $ 2,973 $ 0 $ 0
________________________
(1) Excludes the initial impact from the January 1, 2010 adoption of the new consolidation standards.
See Notes to Consolidated Financial Statements.