Capital One 2010 Annual Report Download - page 68
Download and view the complete annual report
Please find page 68 of the 2010 Capital One annual report below. You can navigate through the pages in the report by either clicking on the pages listed below, or by using the keyword search tool below to find specific information within the annual report.-
 1
1 -
2
-
3
-
4
-
5
-
6
-
7
-
8
-
9
-
10
-
11
-
12
-
13
-
14
-
15
-
16
-
17
-
18
-
19
-
20
-
21
-
22
-
23
-
24
-
25
-
26
-
27
-
28
-
29
-
30
-
31
-
32
-
33
-
34
-
35
-
36
-
37
-
38
-
39
-
40
-
41
-
42
-
43
-
44
-
45
-
46
-
47
-
48
-
49
-
50
-
51
-
52
-
53
-
54
-
55
-
56
-
57
-
 58
58 -
 59
59 -
 60
60 -
 61
61 -
 62
62 -
 63
63 -
 64
64 -
 65
65 -
 66
66 -
 67
67 -
 68
68 -
 69
69 -
 70
70 -
 71
71 -
 72
72 -
 73
73 -
 74
74 -
 75
75 -
 76
76 -
 77
77 -
 78
78 -
79
-
80
-
81
-
82
-
83
-
84
-
85
-
86
-
87
-
88
-
89
-
90
-
91
-
92
-
93
-
94
-
95
-
96
-
97
-
98
-
99
-
100
-
101
-
102
-
103
-
104
-
105
-
106
-
107
-
108
-
109
-
110
-
111
-
112
-
113
-
114
-
115
-
116
-
117
-
118
-
119
-
120
-
121
-
122
-
123
-
124
-
125
-
126
-
127
-
128
-
129
-
130
-
131
-
132
-
133
-
134
-
135
-
136
-
137
-
138
-
139
-
140
-
141
-
142
-
143
-
144
-
145
-
146
-
147
-
148
-
149
-
150
-
151
-
152
-
153
-
154
-
155
-
156
-
157
-
158
-
159
-
160
-
161
-
162
-
163
-
164
-
165
-
166
-
167
-
168
-
169
-
170
-
171
-
172
-
173
-
174
-
175
-
176
-
177
-
178
-
179
-
180
-
181
-
182
-
183
-
184
-
185
-
186
-
187
-
188
-
189
-
190
-
191
-
192
-
193
-
194
-
195
-
196
-
197
-
198
-
199
-
200
-
201
-
202
-
203
-
204
-
205
-
206
-
207
-
208
-
209
-
210
-
211
-
212
-
213
-
214
-
215
-
216
-
217
-
218
-
219
-
220
-
221
-
222
-
223
-
224
-
225
-
226
 |
 |

48
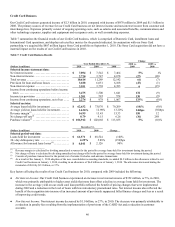
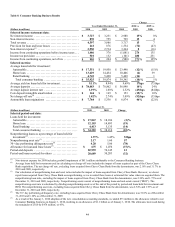
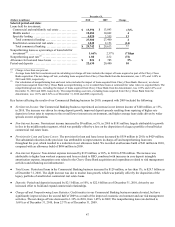
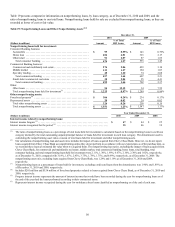
Key factors affecting the results of our Commercial Banking business for 2009, compared with 2008 included the following:
● Net Interest Income: Net interest income increased by $182 million, or 19%, in 2009, largely driven by reduced interest expense
on deposits that more than offset the impact of reduced loan margins.
● Non-Interest Income: Non-interest income increased by $28 million, or 19%, to $172 million, primarily driven by the acquisition
of Chevy Chase Bank, and growth in treasury management, public finance and investment banking fees.
● Provision for Loan and Lease Losses: The provision for loan and lease losses increased by $749 million to $983 million in 2009.
The increase was driven by higher charge offs as well as higher loan loss allowance build as the credit environment deteriorated
in 2009.
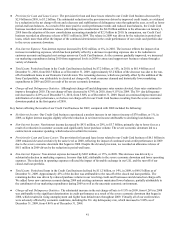
● Non-Interest Expense: Non-interest expense increased by $180 million, or 37%, in 2009 to $661 million. The increase in expense
was largely driven by increases in associates and related salaries and benefits as part of our efforts to enhance our infrastructure
and restructure our operating model. In addition, we incurred increased costs related to loan workout and loss mitigation activities
due to an increase in problem loans resulting from the severe economic downturn.
● Total Loans: Period-end loans in the Commercial Banking business increased by $235 million, or 1%, to $29.6 billion as of
December 31, 2009. The increase was primarily due to the acquisition of the Chevy Chase Bank commercial loan portfolio.
● Deposits: Period-end deposits increased by $4.0 billion, or 24%, to $20.5 billion as of December 31, 2009. The increase was
mainly due to the acquisition of Chevy Chase Bank and our strategy to leverage our bank outlets to attract lower cost funding
sources.
● Charge-off and Nonperforming Loan Statistics: Credit metrics deteriorated throughout much of 2009 due to the severe economic
downturn, which resulted in rising unemployment and significant declines in property values. The net charge-off rate rose to
1.45% in 2009, from 0.29% in 2008, and the nonperforming loan rate increased to 2.37% as of December 31, 2009, from 1.66%
as of December 31, 2008.
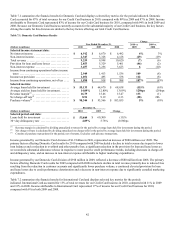
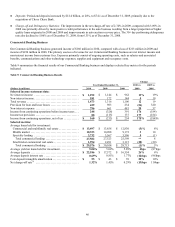
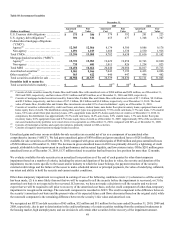
CONSOLIDATED BALANCE SHEET ANALYSIS AND CREDIT PERFORMANCE
Total assets of $197.5 billion as of December 31, 2010, after taking into consideration the $41.9 billion of assets added to our balance
sheet on January 1, 2010 as a result of the adoption of the new consolidation accounting standards, decreased by $27.9 billion, or 8%,
during 2010. Total liabilities of $171.0 billion as of December 31, 2010, after taking into consideration the $44.3 billion of
securitization debt added to our balance sheet on January 1, 2010 as a result of the adoption of the new consolidation standards,
decreased by $16.4 billion, or 12%, during 2010. Our stockholders’ equity, after taking into account the cumulative effect after-tax
charge of $2.9 billion to retained earnings on January 1, 2010 from the adoption of the new consolidation accounting standards,
increased by $2.8 billion during 2010, to $26.5 billion as of December 31, 2010. The increase in stockholders’ equity was primarily
attributable to our net income of $2.7 billion in 2010.
Following is a discussion of material changes in the major components of our assets and liabilities during 2010.
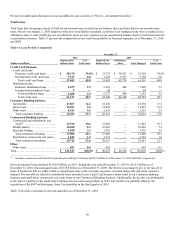
Investment Securities
Our investment securities portfolio, which had a fair value of $41.5 billion and $38.9 billion, as of December 31, 2010 and 2009,
respectively, consists of the following: U.S. Treasury and U.S. agency debt obligations; agency and non-agency mortgage-backed
securities; other asset-backed securities collateralized primarily by credit card loans, auto loans, student loans, auto dealer floor plan
inventory loans, equipment loans and home equity lines of credit; municipal securities; and limited Community Reinvestment Act
(“CRA”) equity securities. Our investment securities portfolio continues to be heavily concentrated in securities that generally have
lower credit risk and high credit ratings, such as securities issued and guaranteed by the U.S. Treasury and government sponsored
enterprises or agencies. Our investments in U.S. Treasury and agency securities, based on fair value, represented approximately 70%
of our total investment securities portfolio as of December 31, 2010, compared with 75% as of December 31, 2009.
All of our investment securities were classified as available for sale as of December 31, 2010 and reported in our consolidated balance
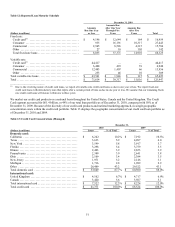
sheet at fair value. Table 10 presents the amortized cost and fair value for the major categories of our investment securities as of
December 31, 2010, 2009 and 2008.