Capital One 2010 Annual Report Download - page 76
Download and view the complete annual report
Please find page 76 of the 2010 Capital One annual report below. You can navigate through the pages in the report by either clicking on the pages listed below, or by using the keyword search tool below to find specific information within the annual report.-
 1
1 -
2
-
3
-
4
-
5
-
6
-
7
-
8
-
9
-
10
-
11
-
12
-
13
-
14
-
15
-
16
-
17
-
18
-
19
-
20
-
21
-
22
-
23
-
24
-
25
-
26
-
27
-
28
-
29
-
30
-
31
-
32
-
33
-
34
-
35
-
36
-
37
-
38
-
39
-
40
-
41
-
42
-
43
-
44
-
45
-
46
-
47
-
48
-
49
-
50
-
51
-
52
-
53
-
54
-
55
-
56
-
57
-
58
-
59
-
60
-
61
-
62
-
63
-
64
-
65
-
 66
66 -
 67
67 -
 68
68 -
 69
69 -
 70
70 -
 71
71 -
 72
72 -
 73
73 -
 74
74 -
 75
75 -
 76
76 -
 77
77 -
 78
78 -
 79
79 -
 80
80 -
 81
81 -
 82
82 -
 83
83 -
 84
84 -
 85
85 -
 86
86 -
87
-
88
-
89
-
90
-
91
-
92
-
93
-
94
-
95
-
96
-
97
-
98
-
99
-
100
-
101
-
102
-
103
-
104
-
105
-
106
-
107
-
108
-
109
-
110
-
111
-
112
-
113
-
114
-
115
-
116
-
117
-
118
-
119
-
120
-
121
-
122
-
123
-
124
-
125
-
126
-
127
-
128
-
129
-
130
-
131
-
132
-
133
-
134
-
135
-
136
-
137
-
138
-
139
-
140
-
141
-
142
-
143
-
144
-
145
-
146
-
147
-
148
-
149
-
150
-
151
-
152
-
153
-
154
-
155
-
156
-
157
-
158
-
159
-
160
-
161
-
162
-
163
-
164
-
165
-
166
-
167
-
168
-
169
-
170
-
171
-
172
-
173
-
174
-
175
-
176
-
177
-
178
-
179
-
180
-
181
-
182
-
183
-
184
-
185
-
186
-
187
-
188
-
189
-
190
-
191
-
192
-
193
-
194
-
195
-
196
-
197
-
198
-
199
-
200
-
201
-
202
-
203
-
204
-
205
-
206
-
207
-
208
-
209
-
210
-
211
-
212
-
213
-
214
-
215
-
216
-
217
-
218
-
219
-
220
-
221
-
222
-
223
-
224
-
225
-
226
 |
 |

56
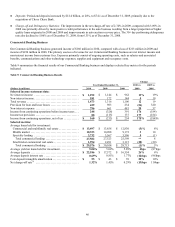
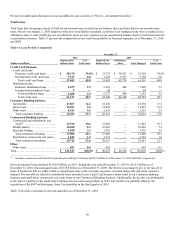
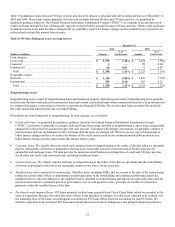
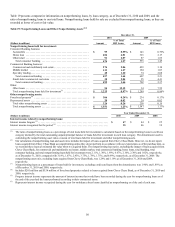
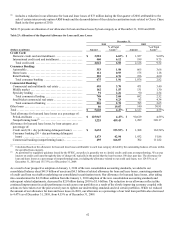
Table 19 presents comparative information on nonperforming loans, by loan category, as of December 31, 2010 and 2009, and the
ratio of nonperforming loans to our total loans. Nonperforming loans held for sale are excluded from nonperforming loans, as they are
recorded at lower of cost or fair value.
Table 19: Nonperforming Loans and Other Nonperforming Assets(1)(2)
December 31,
2010 2009
(Dollars in millions) Amount
% of Total
HFI Loans Amount
% of Total
HFI Loans
Nonperforming loans held for investment:
Consumer Banking business:
Automobile ................................................... $ 99 0.55% $ 143 0.79%
Home loan ................................................... 486 4.01 323 2.17
Other retail ................................................... 91 2.07 87 1.69
Total consumer banking ...................................... 676 1.97 553 1.45
Commercial Banking business:
Commercial and multifamily real estate ............................ 276 2.06 429 3.10
Middle market ................................................ 133 1.27 104 1.03
Specialty lending ............................................... 48 1.20 74 2.08
Total commercial lending ..................................... 457 1.64 607 2.21
Small-ticket commercial real estate ............................... 38 2.04 95 4.41
Total commercial banking ..................................... 495 1.66 702 2.37
Other:
Other loans ................................................... 54 12.12 34 7.52
Total nonperforming loans held for investment
(
3
)
.................... $ 1,225 0.97% $ 1,289 0.94%
Other nonperforming assets:
Foreclosed property
(
4
)
............................................ $ 306 0.24% $ 234 0.17%
Repossessed assets ............................................... 20 0.02 24 0.02
Total other nonperforming assets ................................. 326 0.26 258 0.19
Total nonperforming assets ...................................... $ 1,551 1.23% $ 1,547 1.13%
Year Ended December 31,
(Dollars in millions) 2010 2009 2008
Interest income related to nonperforming loans:
Interest income forgone (5) ........................................................
.
$ 47 $ 44 $ 25
Interest income recognized for the period (6) .........................................
.
35 46 39
________________________
(1) The ratio of nonperforming loans as a percentage of total loans held for investment is calculated based on the nonperforming loans in each loan
category divided by the total outstanding unpaid principal balance of loans held for investment in each loan category. The denominator used in
calculating the nonperforming asset ratios consists of total loans held for investment and other nonperforming assets.
(2) Our calculation of nonperforming loan and asset ratios includes the impact of loans acquired from Chevy Chase Bank. However, we do not report
loans acquired from Chevy Chase Bank as nonperforming unless they do not perform in accordance with our expectations as of the purchase date, as
we recorded these loans at estimated fair value when we acquired them. The nonperforming loan ratios, excluding the impact of loans acquired from
Chevy Chase Bank, for commercial and multifamily real estate, middle market, total commercial banking, home loans, retail banking, total
consumer banking, and total nonperforming loans held for investment were 2.11%, 1.30%, 1.69%, 6.67%, 2.16%, 2.30% and 1.02%, respectively,
as of December 31, 2010, compared with 3.18%, 1.07%, 2.43%, 3.75%, 1.78%, 1.75%, and 0.99%, respectively, as of December 31, 2009. The
nonperforming asset ratio, excluding loans acquired from Chevy Chase Bank, was 1.29% and 1.19% as of December 31, 2010 and 2009,
respectively.
(3) Nonperforming loans as a percentage of loans held for investment, excluding credit card loans from the denominator, was 1.90% and 1.89% as
of December 31, 2010 and 2009, respectively.
(4) Includes $201 million and $154 million of foreclosed properties related to loans acquired from Chevy Chase Bank, as of December 31, 2010 and
2009, respectively.
(5) Forgone interest income represents the amount of interest income that would have been recorded during the year for nonperforming loans as of
the end of the year had the loans performed according to their contractual terms.
(6) Represents interest income recognized during the year for on-balance sheet loans classified as nonperforming as of the end of each year.