Capital One 2010 Annual Report Download - page 3
Download and view the complete annual report
Please find page 3 of the 2010 Capital One annual report below. You can navigate through the pages in the report by either clicking on the pages listed below, or by using the keyword search tool below to find specific information within the annual report.-
 1
1 -
 2
2 -
 3
3 -
 4
4 -
 5
5 -
 6
6 -
 7
7 -
 8
8 -
 9
9 -
 10
10 -
 11
11 -
 12
12 -
 13
13 -
 14
14 -
15
-
16
-
17
-
18
-
19
-
20
-
21
-
22
-
23
-
24
-
25
-
26
-
27
-
28
-
29
-
30
-
31
-
32
-
33
-
34
-
35
-
36
-
37
-
38
-
39
-
40
-
41
-
42
-
43
-
44
-
45
-
46
-
47
-
48
-
49
-
50
-
51
-
52
-
53
-
54
-
55
-
56
-
57
-
58
-
59
-
60
-
61
-
62
-
63
-
64
-
65
-
66
-
67
-
68
-
69
-
70
-
71
-
72
-
73
-
74
-
75
-
76
-
77
-
78
-
79
-
80
-
81
-
82
-
83
-
84
-
85
-
86
-
87
-
88
-
89
-
90
-
91
-
92
-
93
-
94
-
95
-
96
-
97
-
98
-
99
-
100
-
101
-
102
-
103
-
104
-
105
-
106
-
107
-
108
-
109
-
110
-
111
-
112
-
113
-
114
-
115
-
116
-
117
-
118
-
119
-
120
-
121
-
122
-
123
-
124
-
125
-
126
-
127
-
128
-
129
-
130
-
131
-
132
-
133
-
134
-
135
-
136
-
137
-
138
-
139
-
140
-
141
-
142
-
143
-
144
-
145
-
146
-
147
-
148
-
149
-
150
-
151
-
152
-
153
-
154
-
155
-
156
-
157
-
158
-
159
-
160
-
161
-
162
-
163
-
164
-
165
-
166
-
167
-
168
-
169
-
170
-
171
-
172
-
173
-
174
-
175
-
176
-
177
-
178
-
179
-
180
-
181
-
182
-
183
-
184
-
185
-
186
-
187
-
188
-
189
-
190
-
191
-
192
-
193
-
194
-
195
-
196
-
197
-
198
-
199
-
200
-
201
-
202
-
203
-
204
-
205
-
206
-
207
-
208
-
209
-
210
-
211
-
212
-
213
-
214
-
215
-
216
-
217
-
218
-
219
-
220
-
221
-
222
-
223
-
224
-
225
-
226
 |
 |
1
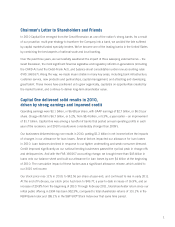
Chairman’s Letter to Shareholders and Friends
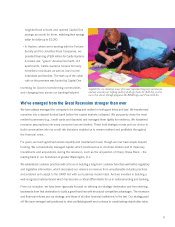
In 2010 Capital One emerged from the Great Recession as one of the nation’s strong banks. As a result
of our proactive, multi-year strategy to transform the Company into a bank, we avoided the fate suffered
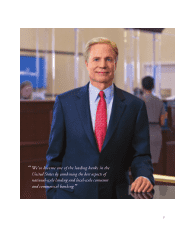
by capital markets-funded specialty lenders. We’ve become one of the leading banks in the United States
by combining the best aspects of national scale and local banking.
Over the past three years, we successfully weathered the impact of three sweeping external forces – the
Great Recession, the most significant financial legislative and regulatory reforms in generations (including
the CARD Act and the Dodd-Frank Act), and balance sheet consolidation under new accounting rules
(FAS 166/167). Along the way, we made major strides in many key areas, including bank infrastructure,
customer service, new products and partnerships, capital management, and attracting and developing
great talent. These moves have positioned us to grow organically, capitalize on opportunities created by
the market turmoil, and continue to deliver long-term shareholder value.
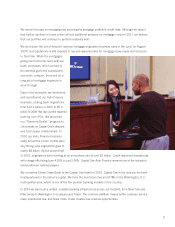
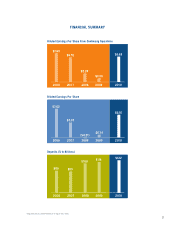
Capital One delivered solid results in 2010,
driven by strong earnings and improved credit
Operating earnings were $3.1 billion, or $6.68 per share, with GAAP earnings of $2.7 billion, or $6.01 per
share. Charge-offs fell to $6.7 billion, or 5.2%, from $8.4 billion, or 5.9%, a year earlier – an improvement
of $1.7 billion. Capital One was among a handful of banks that posted annual operating profits in each
year of the recession, and 2010’s results were considerably stronger than 2009’s.
Our businesses delivered strong core results in 2010, posting $1.3 billion in net income before the impacts
of changes in our allowance for loan losses. Several factors impacted our allowance for loan losses
in 2010. Loan balances declined in response to our tighter underwriting and weak consumer demand.
Credit improved significantly as our national lending businesses passed the cyclical peak in charge-offs
and delinquencies. And with the FAS 166/167 accounting change, we brought more than $45 billion in
loans onto our balance sheet and built our allowance for loan losses by over $4 billion at the beginning
of 2010. The cumulative impact of these factors was a significant allowance release, which added to
our 2010 net income.
Our stock price rose 11% in 2010, to $42.56 per share at year-end, and continued to rise in early 2011.
At the end of February, our stock price had risen to $49.77, a year-to-date increase of 16.9%, and an
increase of 29.8% from the beginning of 2010. Through February 2011, total shareholder return since our
initial public offering in 1994 has been 952.9%, compared to total shareholder returns of 101.1% in the
KBW Bank Index and 185.1% in the S&P 500® Stock Index over that same time period.