Capital One 2010 Annual Report Download - page 107
Download and view the complete annual report
Please find page 107 of the 2010 Capital One annual report below. You can navigate through the pages in the report by either clicking on the pages listed below, or by using the keyword search tool below to find specific information within the annual report.-
 1
1 -
2
-
3
-
4
-
5
-
6
-
7
-
8
-
9
-
10
-
11
-
12
-
13
-
14
-
15
-
16
-
17
-
18
-
19
-
20
-
21
-
22
-
23
-
24
-
25
-
26
-
27
-
28
-
29
-
30
-
31
-
32
-
33
-
34
-
35
-
36
-
37
-
38
-
39
-
40
-
41
-
42
-
43
-
44
-
45
-
46
-
47
-
48
-
49
-
50
-
51
-
52
-
53
-
54
-
55
-
56
-
57
-
58
-
59
-
60
-
61
-
62
-
63
-
64
-
65
-
66
-
67
-
68
-
69
-
70
-
71
-
72
-
73
-
74
-
75
-
76
-
77
-
78
-
79
-
80
-
81
-
82
-
83
-
84
-
85
-
86
-
87
-
88
-
89
-
90
-
91
-
92
-
93
-
94
-
95
-
96
-
 97
97 -
 98
98 -
 99
99 -
 100
100 -
 101
101 -
 102
102 -
 103
103 -
 104
104 -
 105
105 -
 106
106 -
 107
107 -
 108
108 -
 109
109 -
 110
110 -
 111
111 -
 112
112 -
 113
113 -
 114
114 -
 115
115 -
 116
116 -
 117
117 -
118
-
119
-
120
-
121
-
122
-
123
-
124
-
125
-
126
-
127
-
128
-
129
-
130
-
131
-
132
-
133
-
134
-
135
-
136
-
137
-
138
-
139
-
140
-
141
-
142
-
143
-
144
-
145
-
146
-
147
-
148
-
149
-
150
-
151
-
152
-
153
-
154
-
155
-
156
-
157
-
158
-
159
-
160
-
161
-
162
-
163
-
164
-
165
-
166
-
167
-
168
-
169
-
170
-
171
-
172
-
173
-
174
-
175
-
176
-
177
-
178
-
179
-
180
-
181
-
182
-
183
-
184
-
185
-
186
-
187
-
188
-
189
-
190
-
191
-
192
-
193
-
194
-
195
-
196
-
197
-
198
-
199
-
200
-
201
-
202
-
203
-
204
-
205
-
206
-
207
-
208
-
209
-
210
-
211
-
212
-
213
-
214
-
215
-
216
-
217
-
218
-
219
-
220
-
221
-
222
-
223
-
224
-
225
-
226
 |
 |

87
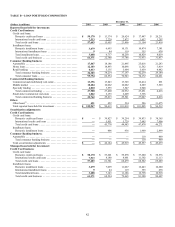
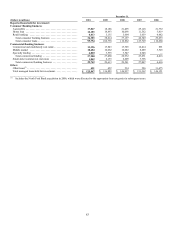
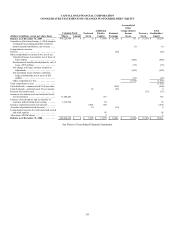
TABLE F—SUMMARY OF ALLOWANCE FOR LOAN AND LEASE LOSSES
December 31,
(Dollars in millions) 2010 2009 2008 2007 2006
Balance at beginning of period, as reported ..............
.
$ 4,127 $ 4,524 $ 2,963 $ 2,180 $ 1,790
Impact from January 1, 2010 adoption of new
consolidation accounting standards ...................
.
4,317(1)
—
—
—
—
Balance at beginning of period, as adjusted ..............
.
$ 8,444 $ 4,524 $ 2,963 $ 2,180 $ 1,790
Provision for loan and lease losses ....................
.
3,907 4,230 5,101 2,717 1,477
Charge-offs:
Domestic credit card and installment ..................
.
(6,020) (3,050) (2,244) (1,315) (1,576)
International credit card and installment ...............
.
(761) (284) (255) (253) (249)
Consumer banking ..................................
.
(898) (1,357) (1,396) (965) (93)
Commercial banking ................................
.
(444) (444) (87) (17) (5)
Other loans .........................................
.
(115) (207) (169) (31) (9)
Total charge-offs ......................................
.
(8,238) (5,342) (4,151) (2,581) (1,932)
Recoveries:
Domestic credit card and installment ..................
.
1,113 447 425 393 450
International credit card and installment ...............
.
169 52 65 72 68
Consumer banking ..................................
.
243 263 178 151 27
Commercial banking ................................
.
54 10 4 4
—
Other loans .........................................
.
8 2 1
—
2
Total recoveries .......................................
.
1,587 774 673 620 547
Net charge-offs ......................................
.
(6,651) (4,568) (3,478) (1,961) (1,385)
Impact from acquisitions, sales and other changes(2) ......
.
(72) (59) (62) 27 298
Balance at end of period ...............................
.
$ 5,628 $ 4,127 $ 4,524 $ 2,963 $ 2,180
Allowance for loan and lease losses as a percentage of
loans held for investment ............................
.
4.47% 4.55% 4.48% 2.91% 2.26%
Allowance for loan and lease losses by geographic
distribution:
Domestic ...........................................
.
$ 5,168 $ 3,928 $ 4,331 $ 2,754 $ 1,950
International ........................................
.
460 199 193 209 230
Total .................................................
.
$ 5,628 $ 4,127 $ 4,524 $ 2,963 $ 2,180
Allowance for loan and lease losses by loan category:
Domestic card ......................................
.
$ 3,581 $ 1,927 $ 2,544 $ 1,429 $ 1,065
International card ...................................
.
460 199 193 209 230
Consumer banking ..................................
.
675 1,076 1,314 1,005 631
Commercial banking ................................
.
826 785 301 153 32
Other (3) ............................................
.
86 140 172 167 222
Total .................................................
.
$ 5,628 $ 4,127 $ 4,524 $ 2,963 $ 2,180
________________________
(1) Includes an adjustment of $53 million made in the second quarter of 2010 for the impact as of January 1, 2010 of impairment on consolidated
loans accounted for as TDRs.
(2) Includes a reduction in our allowance for loan and lease losses of $73 million during the first quarter of 2010 attributable to the sale of certain
interest-only option-ARM bonds and the deconsolidation of the related securitization trusts related to Chevy Chase Bank in the first quarter of
2010.
(3) Includes the North Fork Bank acquisition in 2006, which were allocated to the appropriate loan categories in subsequent years.