Capital One 2010 Annual Report Download - page 131
Download and view the complete annual report
Please find page 131 of the 2010 Capital One annual report below. You can navigate through the pages in the report by either clicking on the pages listed below, or by using the keyword search tool below to find specific information within the annual report.-
 1
1 -
2
-
3
-
4
-
5
-
6
-
7
-
8
-
9
-
10
-
11
-
12
-
13
-
14
-
15
-
16
-
17
-
18
-
19
-
20
-
21
-
22
-
23
-
24
-
25
-
26
-
27
-
28
-
29
-
30
-
31
-
32
-
33
-
34
-
35
-
36
-
37
-
38
-
39
-
40
-
41
-
42
-
43
-
44
-
45
-
46
-
47
-
48
-
49
-
50
-
51
-
52
-
53
-
54
-
55
-
56
-
57
-
58
-
59
-
60
-
61
-
62
-
63
-
64
-
65
-
66
-
67
-
68
-
69
-
70
-
71
-
72
-
73
-
74
-
75
-
76
-
77
-
78
-
79
-
80
-
81
-
82
-
83
-
84
-
85
-
86
-
87
-
88
-
89
-
90
-
91
-
92
-
93
-
94
-
95
-
96
-
97
-
98
-
99
-
100
-
101
-
102
-
103
-
104
-
105
-
106
-
107
-
108
-
109
-
110
-
111
-
112
-
113
-
114
-
115
-
116
-
117
-
118
-
119
-
120
-
 121
121 -
 122
122 -
 123
123 -
 124
124 -
 125
125 -
 126
126 -
 127
127 -
 128
128 -
 129
129 -
 130
130 -
 131
131 -
 132
132 -
 133
133 -
 134
134 -
 135
135 -
 136
136 -
 137
137 -
 138
138 -
 139
139 -
 140
140 -
 141
141 -
142
-
143
-
144
-
145
-
146
-
147
-
148
-
149
-
150
-
151
-
152
-
153
-
154
-
155
-
156
-
157
-
158
-
159
-
160
-
161
-
162
-
163
-
164
-
165
-
166
-
167
-
168
-
169
-
170
-
171
-
172
-
173
-
174
-
175
-
176
-
177
-
178
-
179
-
180
-
181
-
182
-
183
-
184
-
185
-
186
-
187
-
188
-
189
-
190
-
191
-
192
-
193
-
194
-
195
-
196
-
197
-
198
-
199
-
200
-
201
-
202
-
203
-
204
-
205
-
206
-
207
-
208
-
209
-
210
-
211
-
212
-
213
-
214
-
215
-
216
-
217
-
218
-
219
-
220
-
221
-
222
-
223
-
224
-
225
-
226
 |
 |

CAPITAL ONE FINANCIAL CORPORATION
NOTES TO CONSOLIDATED STATEMENTS
111
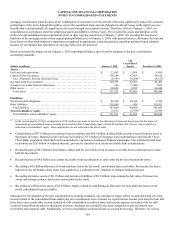
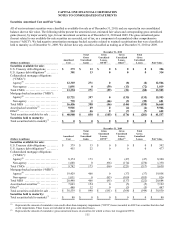
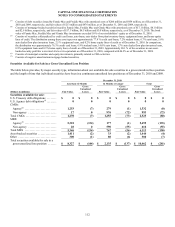
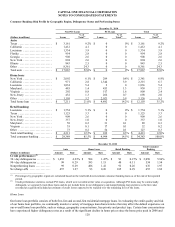
Securities Amortized Cost and Fair Value
All of our investment securities were classified as available-for-sale as of December 31, 2010, and are reported in our consolidated
balance sheet at fair value. The following tables present the amortized cost, estimated fair values and corresponding gross unrealized
gains (losses), by major security type, for our investment securities as of December 31, 2010 and 2009. The gross unrealized gains
(losses) related to our available-for-sale securities are recorded, net of tax, as a component of accumulated other comprehensive
income (“AOCI”). We had negative amortization mortgage backed securities related to retained securitizations that were classified as
held to maturity as of December 31, 2009. We did not have any securities classified as trading as of December 31, 2010 or 2009.
December 31, 2010
(Dollars in millions) Amortized
Cost
Total
Gross
Unrealized
Gains
Gross
Unrealized
Losses-
OTTI(1)
Gross
Unrealized
Losses-
Other(2)
Total
Gross
Unrealized
Losses Fair Value
Securities available for sale:
U.S. Treasury debt obligations ......... $ 373 $ 13 $ 0 $ 0 $ 0 $ 386
U.S. Agency debt obligations(3) ......... 301 13 0 0 0 314
Collateralized mortgage obligations
(“CMOs”):
Agency(4) ........................... 12,303 271 0 (8) (8) 12,566
Non-agency ........................ 1,091 0 (59) (13) (72) 1,019
Total CMOs .......................... 13,394 271 (59) (21) (80) 13,585
Mortgage-backed securities (“MBS”):
Agency(4) ........................... 15,721 397 0 (135) (135) 15,983
Non-agency ........................ 735 1 (46) (9) (55) 681
Total MBS ........................... 16,456 398 (46) (144) (190) 16,664
Asset-backed securities(5) .............. 9,901 69 0 (4) (4) 9,966
Other(6) ............................... 563 66 0 (7) (7) 622
Total securities available for sale ....... $ 40,988 $ 830 $ (105) $ (176) $ (281) $ 41,537
Securities held to maturity:
Total securities held to maturity(7) ...... $ 0 $ 0 $ 0 $ 0 $ 0 $ 0
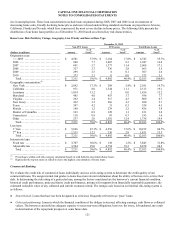
December 31, 2009
(Dollars in millions) Amortized
Cost
Total
Gross
Unrealized
Gains
Gross
Unrealized
Losses-
OTTI(1)
Gross
Unrealized
Losses-
Other(2)
Total
Gross
Unrealized
Losses Fair Value
Securities available for sale:
U.S. Treasury debt obligations ......... $ 379 $ 13 $ 0 $ 0 $ 0 $ 392
U.S. Agency debt obligations(3) ......... 455 22 0 0 0 477
Collateralized mortgage obligations
(“CMOs”):
Agency(4) ........................... 8,174 173 0 (47) (47) 8,300
Non-agency ........................ 1,608 0 (96) (174) (270) 1,338
Total CMOs .......................... 9,782 173 (96) (221) (317) 9,638
Mortgage-backed securities (“MBS”):
Agency(4) ........................... 19,429 466 0 (37) (37) 19,858
Non-agency ........................ 1,011 0 (85) (100) (185) 826
Total MBS ........................... 20,440 466 (85) (137) (222) 20,684
Asset-backed securities(5) .............. 7,043 154 0 (5) (5) 7,192
Other(6) ............................... 440 12 0 (5) (5) 447
Total securities available for sale ....... $ 38,539 $ 840 $ (181) $ (368) $ (549) $ 38,830
Securities held to maturity:
Total securities held to maturity(7) ...... $ 80 $ 0 $ 0 $ 0 $ 0 $ 80
________________________
(1) Represents the amount of cumulative non-credit other-than-temporary impairment (“OTTI”) losses recorded in AOCI on securities that also had
credit impairments. These losses are included in total gross unrealized losses.
(2) Represents the amount of cumulative gross unrealized losses on securities for which we have not recognized OTTI.