Capital One 2010 Annual Report Download - page 151
Download and view the complete annual report
Please find page 151 of the 2010 Capital One annual report below. You can navigate through the pages in the report by either clicking on the pages listed below, or by using the keyword search tool below to find specific information within the annual report.-
 1
1 -
2
-
3
-
4
-
5
-
6
-
7
-
8
-
9
-
10
-
11
-
12
-
13
-
14
-
15
-
16
-
17
-
18
-
19
-
20
-
21
-
22
-
23
-
24
-
25
-
26
-
27
-
28
-
29
-
30
-
31
-
32
-
33
-
34
-
35
-
36
-
37
-
38
-
39
-
40
-
41
-
42
-
43
-
44
-
45
-
46
-
47
-
48
-
49
-
50
-
51
-
52
-
53
-
54
-
55
-
56
-
57
-
58
-
59
-
60
-
61
-
62
-
63
-
64
-
65
-
66
-
67
-
68
-
69
-
70
-
71
-
72
-
73
-
74
-
75
-
76
-
77
-
78
-
79
-
80
-
81
-
82
-
83
-
84
-
85
-
86
-
87
-
88
-
89
-
90
-
91
-
92
-
93
-
94
-
95
-
96
-
97
-
98
-
99
-
100
-
101
-
102
-
103
-
104
-
105
-
106
-
107
-
108
-
109
-
110
-
111
-
112
-
113
-
114
-
115
-
116
-
117
-
118
-
119
-
120
-
121
-
122
-
123
-
124
-
125
-
126
-
127
-
128
-
129
-
130
-
131
-
132
-
133
-
134
-
135
-
136
-
137
-
138
-
139
-
140
-
 141
141 -
 142
142 -
 143
143 -
 144
144 -
 145
145 -
 146
146 -
 147
147 -
 148
148 -
 149
149 -
 150
150 -
 151
151 -
 152
152 -
 153
153 -
 154
154 -
 155
155 -
 156
156 -
 157
157 -
 158
158 -
 159
159 -
 160
160 -
 161
161 -
162
-
163
-
164
-
165
-
166
-
167
-
168
-
169
-
170
-
171
-
172
-
173
-
174
-
175
-
176
-
177
-
178
-
179
-
180
-
181
-
182
-
183
-
184
-
185
-
186
-
187
-
188
-
189
-
190
-
191
-
192
-
193
-
194
-
195
-
196
-
197
-
198
-
199
-
200
-
201
-
202
-
203
-
204
-
205
-
206
-
207
-
208
-
209
-
210
-
211
-
212
-
213
-
214
-
215
-
216
-
217
-
218
-
219
-
220
-
221
-
222
-
223
-
224
-
225
-
226
 |
 |

CAPITAL ONE FINANCIAL CORPORATION
NOTES TO CONSOLIDATED STATEMENTS
131
risk of loss. Those retained tranches were classified as available-for-sale securities, and changes in the estimated fair value were
recorded in other comprehensive income.
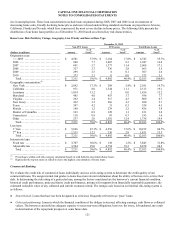
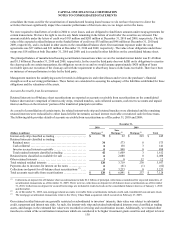
We recognized a net loss of $19 million, $161 million and $260 million in 2010, 2009 and 2008, respectively, related to changes in the
fair value of retained interests. The table below displays the components of the net loss for each year.
Year Ended December 31,
(Dollars in millions) 2010(1) 2009 2008
Interest only strip valuation changes ............................................
.
$ (6) $ (96) $ (225)
Fair value adjustments related to spread accounts ................................
.
5 3 (3)
Fair value adjustments related to investors’ accrued interest receivable ............
.
0 (11) 0
Fair value adjustments related to retained subordinated notes .....................
.
(18) (57) (32)
N
et loss recognized in earnings .................................................
.
$ (19) $ (161) $(260)
________________________
(1) 2010 contains both mortgage related amounts representing valuation changes of mortgage interest only strips, spread accounts, and retained
interests held at December 31, 2010 and non-mortgage related amounts representing the one installment loan securitization that remained off-
balance sheet through September 15, 2010.
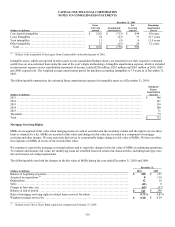
The majority of the change in 2010 was due to the elimination or reclassification of retained interests on January 1, 2010 as a result
the adoption of the new consolidation accounting standards and the subsequent pay down of the off-balance sheet installment loan
trust. The changes in the fair value of retained interests in prior periods were primarily driven by rate assumption changes and volume
fluctuations. All of these retained residual interests were subject to loss in the event assumptions used to determine the estimated fair
value did not prevail, or if borrowers default on the related securitized receivables and our retained subordinated tranches are used to
repay investors. See the table below for key assumptions and sensitivities for retained interest valuations.
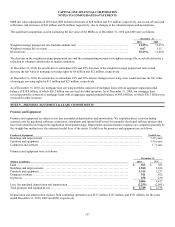
The gain on sale recorded from off-balance sheet securitizations was based on the estimated fair value of the assets sold and retained
and liabilities incurred, and was recorded at the time of sale, net of transaction costs, in servicing and securitizations income on the
Consolidated Statements of Income. The related receivable was the interest-only strip, which was based on the present value of the
estimated future cash flows from excess finance charges and past-due fees over the sum of the return paid to security holders,
estimated contractual servicing fees and credit losses. We periodically reviewed the key assumptions and estimates used in
determining the value of the interest-only strip and other retained interests. We classified the interest-only strip as a trading asset. We
recognized all changes in the fair value of the interest-only strip immediately in servicing and securitizations income on the
Consolidated Statements of Income. The interest component of cash flows attributable to retained interests in securitizations was
recorded in other interest income.
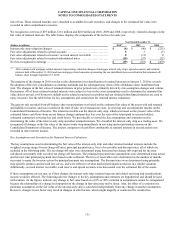
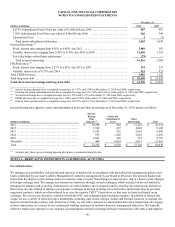
Key Assumptions and Sensitivities for Retained Interest Valuations
The key assumptions used in determining the fair value of the interest-only strip and other retained residual interests include the
weighted average ranges for net charge-off rates, principal payment rates, lives of receivables and discount rates, all of which are
included in the following table. The net charge-off rates were determined using forecasted net charge-offs expected for the trust
calculated consistently with our other net charge-off forecasts. The principal repayment rate assumptions were determined using actual
and forecast trust principal payment rates based on the collateral. The lives of receivables were determined as the number of months
necessary to repay the investors given the principal payment rate assumptions. The discount rates were determined using primarily
trust specific statistics and forward rate curves, and were reflective of what market participants would use in a similar valuation.
Additionally, accrued interest receivable, cash reserve and spread accounts were discounted over the estimated life of the assets.
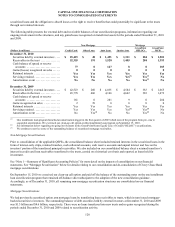
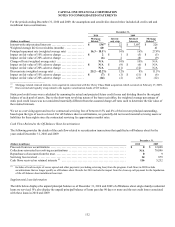
If these assumptions are not met, or if they change, the interest-only strip, retained interests and related servicing and securitizations
income would be affected. The following adverse changes to the key assumptions and estimates are hypothetical and should be used
with caution. As the figures indicate, any change in fair value based on a 10% or 20% variation in assumptions cannot be extrapolated
because the relationship of a change in assumption to the change in fair value may not be linear. Also, the effect of a variation in a
particular assumption on the fair value of the interest-only strip is calculated independently from any change in another assumption.
However, changes in one factor may result in changes in other factors, which might magnify or counteract the sensitivities.