Capital One 2010 Annual Report Download - page 14
Download and view the complete annual report
Please find page 14 of the 2010 Capital One annual report below. You can navigate through the pages in the report by either clicking on the pages listed below, or by using the keyword search tool below to find specific information within the annual report.-
 1
1 -
2
-
3
-
 4
4 -
 5
5 -
 6
6 -
 7
7 -
 8
8 -
 9
9 -
 10
10 -
 11
11 -
 12
12 -
 13
13 -
 14
14 -
 15
15 -
 16
16 -
 17
17 -
 18
18 -
 19
19 -
 20
20 -
 21
21 -
 22
22 -
 23
23 -
 24
24 -
25
-
26
-
27
-
28
-
29
-
30
-
31
-
32
-
33
-
34
-
35
-
36
-
37
-
38
-
39
-
40
-
41
-
42
-
43
-
44
-
45
-
46
-
47
-
48
-
49
-
50
-
51
-
52
-
53
-
54
-
55
-
56
-
57
-
58
-
59
-
60
-
61
-
62
-
63
-
64
-
65
-
66
-
67
-
68
-
69
-
70
-
71
-
72
-
73
-
74
-
75
-
76
-
77
-
78
-
79
-
80
-
81
-
82
-
83
-
84
-
85
-
86
-
87
-
88
-
89
-
90
-
91
-
92
-
93
-
94
-
95
-
96
-
97
-
98
-
99
-
100
-
101
-
102
-
103
-
104
-
105
-
106
-
107
-
108
-
109
-
110
-
111
-
112
-
113
-
114
-
115
-
116
-
117
-
118
-
119
-
120
-
121
-
122
-
123
-
124
-
125
-
126
-
127
-
128
-
129
-
130
-
131
-
132
-
133
-
134
-
135
-
136
-
137
-
138
-
139
-
140
-
141
-
142
-
143
-
144
-
145
-
146
-
147
-
148
-
149
-
150
-
151
-
152
-
153
-
154
-
155
-
156
-
157
-
158
-
159
-
160
-
161
-
162
-
163
-
164
-
165
-
166
-
167
-
168
-
169
-
170
-
171
-
172
-
173
-
174
-
175
-
176
-
177
-
178
-
179
-
180
-
181
-
182
-
183
-
184
-
185
-
186
-
187
-
188
-
189
-
190
-
191
-
192
-
193
-
194
-
195
-
196
-
197
-
198
-
199
-
200
-
201
-
202
-
203
-
204
-
205
-
206
-
207
-
208
-
209
-
210
-
211
-
212
-
213
-
214
-
215
-
216
-
217
-
218
-
219
-
220
-
221
-
222
-
223
-
224
-
225
-
226
 |
 |

12
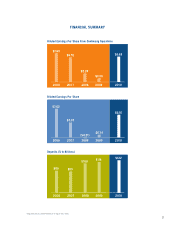
(Dollars in millions, except per share data) 2010 2009
Income Statement(1):
Net interest income $ 12,457 $ 12,089
Non-interest income 3,714 4,747
Total revenue 16,171 16,836
Provision for loan losses 3,907 8,083
Marketing expenses 958 588
Restructuring expenses — 119
Operating expenses 6,975 6,710
Income from continuing operations before taxes 4,330 1,336
Effective income tax rate 29.6 % 26.2 %
Income from continuing operations, net of tax 3,050 987
Loss from discontinued operations, net of tax (307) (103)
Net income $ 2,743 $ 884
Preferred stock dividends — (564)
Net income available to common shareholders $ 2,743 $ 320
Common Share Statistics:
Basic EPS:
Net income from continuing operations $ 6.74 $ 0.99
Net loss from discontinued operations (0.67) (0.24)
Net income $ 6.07 $ 0.75
Diluted EPS:
Net income from continuing operations $ 6.68 $ 0.98
Net loss from discontinued operations (0.67) (0.24)
Net income $ 6.01 0.74
Dividends $ 0.20 $ 0.53
Reported Balance Sheet Statistics:
Loans held for investment $ 125,947 $ 90,619
Total assets 197,503 169,646
Interest-bearing deposits 107,162 102,370
Total deposits 122,210 115,809
Reported Average Balances:
Average loans held for investment $ 128,526 $ 99,787
Average earning assets 175,730 145,293
Average total assets 200,114 171,598
Average stockholders’ equity 24,941 26,606
Reported Credit Quality Metrics:
Allowance for loan losses $ 5,628 $ 4,127
Allowance as a % of reported loans held for investment 4.47 % 4.55 %
Net charge-offs $ 6,651 $ 4,568
Net charge-off rate 5.18 % 4.58 %
30+ day performing delinquency rate 3.52 3.98
Reported Performance Metrics:
Revenue growth (3.95) % (6.55) %
Net interest margin 7.09 5.30
Revenue margin 9.20 8.94
Risk-adjusted margin 5.42 5.79
Return on average assets 1.52 0.58
Return on average equity 12.23 3.71
Full-time equivalent employees (in thousands) 25.7 25.9
Managed Balance Sheet Metrics:
Loans held for investment $ 125,947 $ 136,803
Total assets 197,142 212,390
Average loans held for investment 128,622 143,514
Average total assets 200,142 212,633
Tangible common equity (TCE) ratio 6.86 % 6.30 %
Managed Performance Metrics:
Net interest margin 7.09 % 6.50 %
Revenue margin 9.20 9.05
Risk-adjusted margin 5.42 4.53
Net charge-off rate 5.18 5.87
30+ day performing delinquency rate 3.52 4.62
Efficiency ratio(2) 49.06 43.35
Period-end total loan accounts (in millions) 37.4 37.8
Full-time equivalent employees (in thousands) 25.7 25.9
(1) 2009 amounts represent our managed results.
(2) Excludes restructuring expenses.