Capital One 2010 Annual Report Download - page 222
Download and view the complete annual report
Please find page 222 of the 2010 Capital One annual report below. You can navigate through the pages in the report by either clicking on the pages listed below, or by using the keyword search tool below to find specific information within the annual report.-
 1
1 -
2
-
3
-
4
-
5
-
6
-
7
-
8
-
9
-
10
-
11
-
12
-
13
-
14
-
15
-
16
-
17
-
18
-
19
-
20
-
21
-
22
-
23
-
24
-
25
-
26
-
27
-
28
-
29
-
30
-
31
-
32
-
33
-
34
-
35
-
36
-
37
-
38
-
39
-
40
-
41
-
42
-
43
-
44
-
45
-
46
-
47
-
48
-
49
-
50
-
51
-
52
-
53
-
54
-
55
-
56
-
57
-
58
-
59
-
60
-
61
-
62
-
63
-
64
-
65
-
66
-
67
-
68
-
69
-
70
-
71
-
72
-
73
-
74
-
75
-
76
-
77
-
78
-
79
-
80
-
81
-
82
-
83
-
84
-
85
-
86
-
87
-
88
-
89
-
90
-
91
-
92
-
93
-
94
-
95
-
96
-
97
-
98
-
99
-
100
-
101
-
102
-
103
-
104
-
105
-
106
-
107
-
108
-
109
-
110
-
111
-
112
-
113
-
114
-
115
-
116
-
117
-
118
-
119
-
120
-
121
-
122
-
123
-
124
-
125
-
126
-
127
-
128
-
129
-
130
-
131
-
132
-
133
-
134
-
135
-
136
-
137
-
138
-
139
-
140
-
141
-
142
-
143
-
144
-
145
-
146
-
147
-
148
-
149
-
150
-
151
-
152
-
153
-
154
-
155
-
156
-
157
-
158
-
159
-
160
-
161
-
162
-
163
-
164
-
165
-
166
-
167
-
168
-
169
-
170
-
171
-
172
-
173
-
174
-
175
-
176
-
177
-
178
-
179
-
180
-
181
-
182
-
183
-
184
-
185
-
186
-
187
-
188
-
189
-
190
-
191
-
192
-
193
-
194
-
195
-
196
-
197
-
198
-
199
-
200
-
201
-
202
-
203
-
204
-
205
-
206
-
207
-
208
-
209
-
210
-
211
-
 212
212 -
 213
213 -
 214
214 -
 215
215 -
 216
216 -
 217
217 -
 218
218 -
 219
219 -
 220
220 -
 221
221 -
 222
222 -
 223
223 -
 224
224 -
 225
225 -
 226
226
 |
 |
Page 7
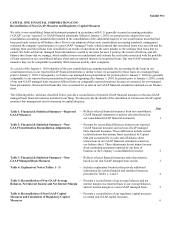
CAPITAL ONE FINANCIAL CORPORATION (COF)
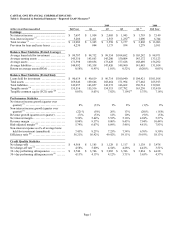
Table 6: Reconciliation of Non-GAAP Capital Measures and Calculation of Regulatory Capital Measures
In addition to disclosing required regulatory measures, the Company also reports certain non-GAAP capital measures that
management uses in assessing its capital adequacy. These non-GAAP measures include average tangible common equity, tangible
common equity (TCE), TCE ratio, Tier 1 common equity and Tier 1 common equity ratio. The table below provides the details of the
calculation of each of these measures. While these non-GAAP capital measures are widely used by investors, analysts and bank
regulatory agencies to assess the capital position of financial services companies, they may not be comparable to similarly titled
measures reported by other companies.
(dollars in millions)(unaudited)
2010
Q4
2010
Q3
2010
Q2
2010
Q1
2009
Q4
Average Equity to Non-GAAP Average Tangible Common Equity
Average total stockholders’ equity . . . . . . . . . . . . . . . . . . . . . . . . . . . . . . . . . . . . . . . . . . . . . . . . $ 26,255 $ 25,307 $ 24,526 $ 23,681 $ 26,518
Less: Average preferred stock ....................................................
—
—
—
—
—
Less: Average intangible assets
(1)
. . . . . . . . . . . . . . . . . . . . . . . . . . . . . . . . . . . . . . . . . . . . . . . . (14,008) (14,003) (14,039) (14,075) (14,105)
Average tangible common equity . . . . . . . . . . . . . . . . . . . . . . . . . . . . . . . . . . . . . . . . . . . . . . . . . $ 12,247 $ 11,304 $ 10,487 $ 9,606 $ 12,413
Stockholders Equity to Non-GAAP Tangible Common Equity
Total stockholders’ equity . . . . . . . . . . . . . . . . . . . . . . . . . . . . . . . . . . . . . . . . . . . . . . . . . . . . . . . . $ 26,541 $ 26,061 $ 25,270 $ 24,374 $ 26,589
Less: Preferred stock .............................................................
—
—
—
—
—
Less: Intangible assets
(1)
......................................................... (13,983) (14,024) (14,011) (14,044) (14,106)
Tangible common equity . . . . . . . . . . . . . . . . . . . . . . . . . . . . . . . . . . . . . . . . . . . . . . . . . . . . . . . . . $ 12,558 $ 12,037 $ 11,259 $ 10,330 $ 12,483
Total Assets to Tangible Assets
Total assets . . . . . . . . . . . . . . . . . . . . . . . . . . . . . . . . . . . . . . . . . . . . . . . . . . . . . . . . . . . . . . . . . . . . . . $197,503 $ 196,933 $ 197,489 $ 200,707 $ 169,646
Less: Assets from discontinued operations . . . . . . . . . . . . . . . . . . . . . . . . . . . . . . . . . . . . . . . . (362) (5) (4) (16) (24)
Total assets from continuing operations . . . . . . . . . . . . . . . . . . . . . . . . . . . . . . . . . . . . . . . . . . . 197,141 196,928 197,485 200,691 169,622
Less: Intangible assets
(1)
......................................................... (13,983) (14,024) (14,011) (14,044) (14,106)
Tangible assets . . . . . . . . . . . . . . . . . . . . . . . . . . . . . . . . . . . . . . . . . . . . . . . . . . . . . . . . . . . . . . . . . . . $183,158 $ 182,904 $ 183,474 $ 186,647 $ 155,516
Non-GAAP TCE Ratio
Tangible common equity . . . . . . . . . . . . . . . . . . . . . . . . . . . . . . . . . . . . . . . . . . . . . . . . . . . . . . . . . $ 12,558 $ 12,037 $ 11,259 $ 10,330 $ 12,483
Tangible assets . . . . . . . . . . . . . . . . . . . . . . . . . . . . . . . . . . . . . . . . . . . . . . . . . . . . . . . . . . . . . . . . . . . $183,158 $ 182,904 $ 183,474 $ 186,647 $ 155,516
TCE ratio
(2)
...................................................................... 6.86% 6.58% 6.14% 5.53% 8.03%
Non-GAAP Managed Basis TCE Ratio
Total reported assets . . . . . . . . . . . . . . . . . . . . . . . . . . . . . . . . . . . . . . . . . . . . . . . . . . . . . . . . . . . . . $197,503 $ 196,933 $ 197,489 $ 200,707 $ 169,646
Plus: Securitization adjustment
(3)
.................................................
—
—
—
—
42,767
Total managed assets . . . . . . . . . . . . . . . . . . . . . . . . . . . . . . . . . . . . . . . . . . . . . . . . . . . . . . . . . . . . . $197,503 $ 196,933 $ 197,489 $ 200,707 $ 212,413
Less: Assets from discontinued operations . . . . . . . . . . . . . . . . . . . . . . . . . . . . . . . . . . . . . . . . (362) (5) (4) (16) (24)
Total assets from continuing operations . . . . . . . . . . . . . . . . . . . . . . . . . . . . . . . . . . . . . . . . . . . 197,141 196,928 197,485 200,691 212,389
Less: Intangible assets
(1)
......................................................... (13,983) (14,024) (14,011) (14,044) (14,106)
Managed tangible assets . . . . . . . . . . . . . . . . . . . . . . . . . . . . . . . . . . . . . . . . . . . . . . . . . . . . . . . . . . $183,158 $ 182,904 $ 183,474 $ 186,647 $ 198,283
Tangible common equity . . . . . . . . . . . . . . . . . . . . . . . . . . . . . . . . . . . . . . . . . . . . . . . . . . . . . . . . . $ 12,558 $ 12,037 $ 11,259 $ 10,330 $ 12,483
Managed tangible assets . . . . . . . . . . . . . . . . . . . . . . . . . . . . . . . . . . . . . . . . . . . . . . . . . . . . . . . . . . $183,158 $ 182,904 $ 183,474 $ 186,647 $ 198,283
Managed TCE ratio
(2)
............................................................ 6.86% 6.58% 6.14% 5.53% 6.30%
Non-GAAP Tier 1 Common Equity and Regulatory Capital Ratios
Total stockholders’ equity . . . . . . . . . . . . . . . . . . . . . . . . . . . . . . . . . . . . . . . . . . . . . . . . . . . . . . . . . $ 26,541 $ 26,061 $ 25,270 $ 24,374 $ 26,589
Less: Net unrealized (gains) losses on AFS securities recorded in AOCI
(4)
. . . . . . . . (368) (580) (661) (319) (200)
Net (gains) losses on cash flow hedges recorded in AOCI(4) . . . . . . . . . . . . . . . . 86 79 73 80 92
Disallowed goodwill and other intangible assets . . . . . . . . . . . . . . . . . . . . . . . . . . . (13,953) (13,993) (14,023) (14,078) (14,125)
Disallowed deferred tax assets ............................................ (1,150) (1,324) (1,977) (2,183)
—
Other ..................................................................... (2) (2) (2) (1) (9)
Tier 1 common equity . . . . . . . . . . . . . . . . . . . . . . . . . . . . . . . . . . . . . . . . . . . . . . . . . . . . . . . . . . . . $ 11,154 $ 10,241 $ 8,680 $ 7,873 $ 12,347
Plus: Tier 1 restricted core capital items
(
5
)
......................................... 3,636 3,636 3,637 3,638 3,642
Tier 1 capital . . . . . . . . . . . . . . . . . . . . . . . . . . . . . . . . . . . . . . . . . . . . . . . . . . . . . . . . . . . . . . . . . . . . . $ 14,790 $ 13,877 $ 12,317 $ 11,511 $ 15,989
Plus: Long-term debt qualifying as Tier 2 capital 2,827 2,827 2,898 3,018 3,018
Qualifying allowance for loan and lease losses . . . . . . . . . . . . . . . . . . . . . . . . . . . . . 3,748 3,726 5,836 5,802 1,581
Other Tier 2 components .................................................. 29 24 25 4 4
Tier 2 capital ..................................................................... $ 6,604 $ 6,577 $ 8,759 $ 8,824 $ 4,603
Total risk-based capital
(6)
......................................................... $ 21,394 $ 20,454 $ 21,076 $ 20,335 $ 20,592
Risk-weighted assets
(
7
)
........................................................... $127,043 $ 124,726 $ 124,038 $ 120,330 $ 116,309
Tier 1 common equity ratio
(8)
.................................................... 8.78%
(11)
8.21% 7.00% 6.54% 10.62%
Tier 1 risk-based capital ratio
(9)
.................................................. 11.64%
(11)
11.13% 9.93% 9.57% 13.75%
Total risk-based capital ratio
(10)
.................................................. 16.84%
(11)
16.40% 16.99% 16.90% 17.70%