Capital One 2010 Annual Report Download - page 58
Download and view the complete annual report
Please find page 58 of the 2010 Capital One annual report below. You can navigate through the pages in the report by either clicking on the pages listed below, or by using the keyword search tool below to find specific information within the annual report.-
 1
1 -
2
-
3
-
4
-
5
-
6
-
7
-
8
-
9
-
10
-
11
-
12
-
13
-
14
-
15
-
16
-
17
-
18
-
19
-
20
-
21
-
22
-
23
-
24
-
25
-
26
-
27
-
28
-
29
-
30
-
31
-
32
-
33
-
34
-
35
-
36
-
37
-
38
-
39
-
40
-
41
-
42
-
43
-
44
-
45
-
46
-
47
-
 48
48 -
 49
49 -
 50
50 -
 51
51 -
 52
52 -
 53
53 -
 54
54 -
 55
55 -
 56
56 -
 57
57 -
 58
58 -
 59
59 -
 60
60 -
 61
61 -
 62
62 -
 63
63 -
 64
64 -
 65
65 -
 66
66 -
 67
67 -
 68
68 -
69
-
70
-
71
-
72
-
73
-
74
-
75
-
76
-
77
-
78
-
79
-
80
-
81
-
82
-
83
-
84
-
85
-
86
-
87
-
88
-
89
-
90
-
91
-
92
-
93
-
94
-
95
-
96
-
97
-
98
-
99
-
100
-
101
-
102
-
103
-
104
-
105
-
106
-
107
-
108
-
109
-
110
-
111
-
112
-
113
-
114
-
115
-
116
-
117
-
118
-
119
-
120
-
121
-
122
-
123
-
124
-
125
-
126
-
127
-
128
-
129
-
130
-
131
-
132
-
133
-
134
-
135
-
136
-
137
-
138
-
139
-
140
-
141
-
142
-
143
-
144
-
145
-
146
-
147
-
148
-
149
-
150
-
151
-
152
-
153
-
154
-
155
-
156
-
157
-
158
-
159
-
160
-
161
-
162
-
163
-
164
-
165
-
166
-
167
-
168
-
169
-
170
-
171
-
172
-
173
-
174
-
175
-
176
-
177
-
178
-
179
-
180
-
181
-
182
-
183
-
184
-
185
-
186
-
187
-
188
-
189
-
190
-
191
-
192
-
193
-
194
-
195
-
196
-
197
-
198
-
199
-
200
-
201
-
202
-
203
-
204
-
205
-
206
-
207
-
208
-
209
-
210
-
211
-
212
-
213
-
214
-
215
-
216
-
217
-
218
-
219
-
220
-
221
-
222
-
223
-
224
-
225
-
226
 |
 |

38
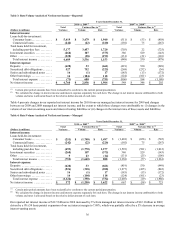
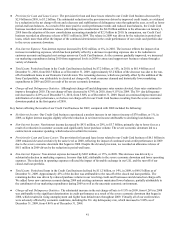
mortgage-related securities in 2010 because of our intent to sell the securities. We provide additional information on other-than-
temporary impairment recognized on our available-for-sale securities in “Note 4—Investment Securities.”
The $670 million decrease in managed non-interest income in 2009 from 2008 was largely due to reduced service charges and
customer-related fees as a result of lower overlimit and cash advance fees.
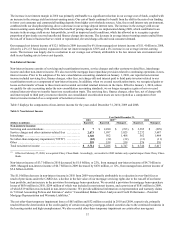
Provision for Loan and Lease Losses
We build our allowance for loan and lease losses through the provision for loan and lease losses. Our provision for loan and lease
losses in each period is driven by charge-offs and the level of allowance for loan and lease losses that we determine is necessary to
provide for probable credit losses inherent in our loan portfolio as of each balance sheet date.
We recorded a reported provision for loan and lease losses of $3.9 billion in 2010, compared with a reported provision for loan and
lease losses of $4.2 billion in 2009 and $5.1 billion in 2008. Our managed provision for loan and lease losses totaled $8.1 billon and
$8.0 billon in 2009 and 2008, respectively. The significant decrease in the managed provision expense for loan and lease losses in
2010 was attributable to reduced charge-offs and continued improvement in credit performance, as well as a reduction in our loan
portfolio balance. As a result, we recorded a significant reduction in our allowance for loan and lease losses during 2010. The decrease
in the provision for loan and lease losses in 2009 from 2008 was largely due to a significant decline in our loan portfolio balance.
Table 22 below, under “Consolidated Balance Sheet Analysis—Summary of Reported Allowance for Loan and Lease Losses”
summarizes changes in our allowance for loan and lease losses and details the provision for loan and lease losses recognized in our
consolidated statements of income and the charge-offs recorded against our allowance for loan and lease losses in 2010, 2009 and 2008.
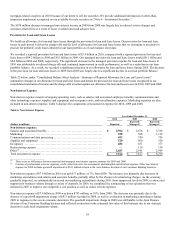
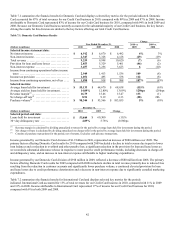
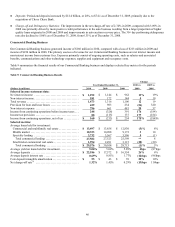
Non-Interest Expense
Non-interest expense consists of ongoing operating costs, such as salaries and associated employee benefits, communications and
other technology expenses, supplies and equipment and occupancy costs, and miscellaneous expenses. Marketing expenses are also
included in non-interest expense. Table 6 displays the components of non-interest expense for 2010, 2009 and 2008.
Table 6: Non-Interest Expense
Year Ended December 31,
2010 2009 2008
(Dollars in millions) Reported
Reported/
Managed(1)
Reported/
Managed(1)
Non-interest expense:
Salaries and associated benefits ............................................ $ 2,594 $ 2,478 $ 2,336
Marketing ................................................................ 958 588 1,118
Communications and data processing ....................................... 693 740 756
Supplies and equipment ................................................... 520 500 520
Occupancy ............................................................... 486 451 377
Restructuring expense .....................................................
—
119 134
Other(2) ................................................................... 2,683 2,541 2,969
Total non-interest expense ................................................. $ 7,934 $ 7,417 $ 8,210
________________________
(1) There were no differences between reported and managed non-interest expense amounts for 2009 and 2008.
(2) Consists of professional services expenses, credit collection costs, fee assessments and intangible amortization expense. Other non-interest
expense for 2008 includes goodwill impairment of $811 million related to the Auto Finance division of our Consumer Banking business.
Non-interest expense of $7.9 billion in 2010 was up $517 million, or 7%, from 2009. The increase was primarily due increases in
marketing expenditures and salaries and associate benefits, partially offset by the absence of restructuring charges. As the economy
gradually improved, we substantially increased our marketing expenditures during 2010, from suppressed levels in 2009, to attract and
support new business volume through a variety of channels. In 2009, we completed the restructuring of our operations that was
initiated in 2007 to improve our competitive cost position as well as reduce certain expenses.
Non-interest expense of $7.4 billion in 2009 was down $793 million, or 10%, from 2008. The decrease was primarily due to the
absence of a goodwill impairment charge of $811 million recorded in 2008, as well as a reduction in marketing expenditures during
2009 in response to the severe economic downturn. The goodwill impairment charge in 2008 was attributable to the Auto Finance
division of our Consumer Banking business and reflected a reduction in the estimated fair value of this business due to our strategic
decision to scale back origination volume.