Capital One 2010 Annual Report Download - page 73
Download and view the complete annual report
Please find page 73 of the 2010 Capital One annual report below. You can navigate through the pages in the report by either clicking on the pages listed below, or by using the keyword search tool below to find specific information within the annual report.-
 1
1 -
2
-
3
-
4
-
5
-
6
-
7
-
8
-
9
-
10
-
11
-
12
-
13
-
14
-
15
-
16
-
17
-
18
-
19
-
20
-
21
-
22
-
23
-
24
-
25
-
26
-
27
-
28
-
29
-
30
-
31
-
32
-
33
-
34
-
35
-
36
-
37
-
38
-
39
-
40
-
41
-
42
-
43
-
44
-
45
-
46
-
47
-
48
-
49
-
50
-
51
-
52
-
53
-
54
-
55
-
56
-
57
-
58
-
59
-
60
-
61
-
62
-
 63
63 -
 64
64 -
 65
65 -
 66
66 -
 67
67 -
 68
68 -
 69
69 -
 70
70 -
 71
71 -
 72
72 -
 73
73 -
 74
74 -
 75
75 -
 76
76 -
 77
77 -
 78
78 -
 79
79 -
 80
80 -
 81
81 -
 82
82 -
 83
83 -
84
-
85
-
86
-
87
-
88
-
89
-
90
-
91
-
92
-
93
-
94
-
95
-
96
-
97
-
98
-
99
-
100
-
101
-
102
-
103
-
104
-
105
-
106
-
107
-
108
-
109
-
110
-
111
-
112
-
113
-
114
-
115
-
116
-
117
-
118
-
119
-
120
-
121
-
122
-
123
-
124
-
125
-
126
-
127
-
128
-
129
-
130
-
131
-
132
-
133
-
134
-
135
-
136
-
137
-
138
-
139
-
140
-
141
-
142
-
143
-
144
-
145
-
146
-
147
-
148
-
149
-
150
-
151
-
152
-
153
-
154
-
155
-
156
-
157
-
158
-
159
-
160
-
161
-
162
-
163
-
164
-
165
-
166
-
167
-
168
-
169
-
170
-
171
-
172
-
173
-
174
-
175
-
176
-
177
-
178
-
179
-
180
-
181
-
182
-
183
-
184
-
185
-
186
-
187
-
188
-
189
-
190
-
191
-
192
-
193
-
194
-
195
-
196
-
197
-
198
-
199
-
200
-
201
-
202
-
203
-
204
-
205
-
206
-
207
-
208
-
209
-
210
-
211
-
212
-
213
-
214
-
215
-
216
-
217
-
218
-
219
-
220
-
221
-
222
-
223
-
224
-
225
-
226
 |
 |

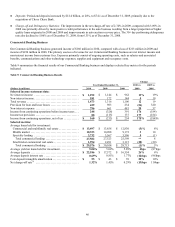
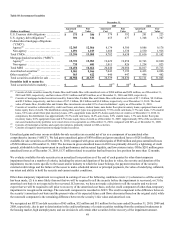
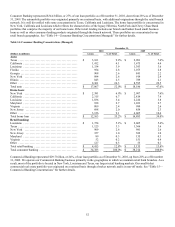
53
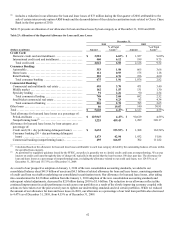
Table 15: Commercial Banking Concentrations (Managed)
December 31,
2010 2009
(Dollars in millions) Loans % of Total Loans % of Total
Commercial lending:
N
ew York ............................................ $ 11,997 40.3% $ 12,566 42.5%
Texas ................................................ 2,990 10.1 2,785 9.4
Louisiana ............................................ 2,968 10.0 3,592 12.1
N
ew Jersey ........................................... 2,149 7.2 2,253 7.6
Massachusetts ........................................ 800 2.7 619 2.1
Maryland ............................................. 646 2.2 509 1.7
California ............................................ 598 2.0 571 1.9
Other ................................................ 5,752 19.3 4,565 15.4
Total commercial lending .............................. $ 27,900 93.8% $ 27,460 92.7%
Small-ticket commercial real estate:
N
ew York ............................................ $ 751 2.5% $ 864 2.9%
California ............................................ 402 1.4 468 1.6
Massachusetts ........................................ 146 0.5 165 0.6
N
ew Jersey ........................................... 102 0.3 123 0.4
Florida ............................................... 76 0.3 94 0.3
Other ................................................ 365 1.2 439 1.5
Total small-ticket commercial real estate ................ $ 1,842 6.2% $ 2,153 7.3%
Total commercial banking ............................. $ 29,742 100.0% $ 29,613 100.0%
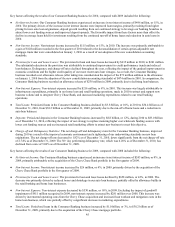
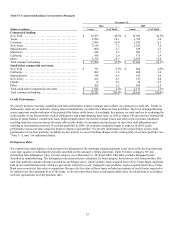
Credit Performance
We closely monitor economic conditions and loan performance trends to manage and evaluate our exposure to credit risk. Trends in
delinquency ratios are an indicator, among other considerations, of credit risk within our loan portfolios. The level of nonperforming
assets represents another indicator of the potential for future credit losses. Accordingly, key metrics we track and use in evaluating the
credit quality of our loan portfolio include delinquency and nonperforming asset rates, as well as charge-off rates and our internal risk
ratings of larger balance, commercial loans. High unemployment, the decline in home prices and other weak economic conditions
resulting from the recent recession adversely affected the ability of consumers and businesses to meet their debt obligations and
resulting in deterioration across all of our loan portfolios in 2009. As economic conditions began to improve in 2010, credit
performance across our loan categories began to improve and stabilize. We present information in the section below on the credit
performance of our loan portfolio, including the key metrics we use in tracking changes in the credit quality of our loan portfolio. See
“Note 5—Loans” for additional details.
Delinquency Rates
We consider the entire balance of an account to be delinquent if the minimum required payment is not received by the first statement
cycle date equal to or following the due date specified on the customer’s billing statement. Table 16 below compares 30+ day
performing loan delinquency rates, by loan category, as of December 31, 2010 and 2009. This table excludes delinquent loans
classified as nonperforming. The delinquency rates presented are calculated, by loan category, based on our total loan portfolio. Our
total loan portfolio consists of loans recorded on our balance sheet, which includes loans acquired from Chevy Chase Bank, and loans
held in our securitization trusts, which we previously referred to as our “managed” loan portfolio. Loans acquired from Chevy Chase
Bank were recorded at fair value at acquisition. Because the fair value of these loans included an estimate of credit losses expected to
be realized over the remaining lives of the loans, we do not report these loans as delinquent unless they do not perform in accordance
with our expectations as of the purchase date.