Capital One 2010 Annual Report Download - page 51
Download and view the complete annual report
Please find page 51 of the 2010 Capital One annual report below. You can navigate through the pages in the report by either clicking on the pages listed below, or by using the keyword search tool below to find specific information within the annual report.-
 1
1 -
2
-
3
-
4
-
5
-
6
-
7
-
8
-
9
-
10
-
11
-
12
-
13
-
14
-
15
-
16
-
17
-
18
-
19
-
20
-
21
-
22
-
23
-
24
-
25
-
26
-
27
-
28
-
29
-
30
-
31
-
32
-
33
-
34
-
35
-
36
-
37
-
38
-
39
-
40
-
 41
41 -
 42
42 -
 43
43 -
 44
44 -
 45
45 -
 46
46 -
 47
47 -
 48
48 -
 49
49 -
 50
50 -
 51
51 -
 52
52 -
 53
53 -
 54
54 -
 55
55 -
 56
56 -
 57
57 -
 58
58 -
 59
59 -
 60
60 -
 61
61 -
62
-
63
-
64
-
65
-
66
-
67
-
68
-
69
-
70
-
71
-
72
-
73
-
74
-
75
-
76
-
77
-
78
-
79
-
80
-
81
-
82
-
83
-
84
-
85
-
86
-
87
-
88
-
89
-
90
-
91
-
92
-
93
-
94
-
95
-
96
-
97
-
98
-
99
-
100
-
101
-
102
-
103
-
104
-
105
-
106
-
107
-
108
-
109
-
110
-
111
-
112
-
113
-
114
-
115
-
116
-
117
-
118
-
119
-
120
-
121
-
122
-
123
-
124
-
125
-
126
-
127
-
128
-
129
-
130
-
131
-
132
-
133
-
134
-
135
-
136
-
137
-
138
-
139
-
140
-
141
-
142
-
143
-
144
-
145
-
146
-
147
-
148
-
149
-
150
-
151
-
152
-
153
-
154
-
155
-
156
-
157
-
158
-
159
-
160
-
161
-
162
-
163
-
164
-
165
-
166
-
167
-
168
-
169
-
170
-
171
-
172
-
173
-
174
-
175
-
176
-
177
-
178
-
179
-
180
-
181
-
182
-
183
-
184
-
185
-
186
-
187
-
188
-
189
-
190
-
191
-
192
-
193
-
194
-
195
-
196
-
197
-
198
-
199
-
200
-
201
-
202
-
203
-
204
-
205
-
206
-
207
-
208
-
209
-
210
-
211
-
212
-
213
-
214
-
215
-
216
-
217
-
218
-
219
-
220
-
221
-
222
-
223
-
224
-
225
-
226
 |
 |
31
Investment Securities
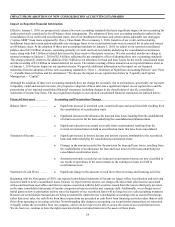
We regularly review investment securities for other-than-temporary impairment using both quantitative and qualitative criteria.
Effective April 1, 2009, the Financial Accounting Standards Board (“FASB”) amended and modified the requirements for recognizing
and measuring other-than-temporary impairment for debt securities. If we intend to sell a security in an unrealized loss position or it is
more likely than not we will be required to sell a security before its anticipated recovery, the entire difference between the amortized
cost basis of the security and its fair value is recognized in earnings. If we do not intend to sell the security and it is not more likely
than not that we will be required to sell the security before recovery of our amortized cost, we evaluate other qualitative criteria to
determine whether a credit loss exists. Our evaluation requires significant management judgment and a consideration of many factors,
including, but not limited to, the extent and duration of the impairment; the health of and specific prospects for the issuer, including
whether the issuer has failed to make scheduled interest or principal payments; recent events specific to the issuer and/or industry to
which the issuer belongs; the payment structure of the security; external credit ratings; the value of underlying collateral and current
market conditions. Quantitative criteria include assessing whether there has been an adverse change in expected future cash flows. For
equity securities, our evaluation criteria include the length of time and magnitude of the amount that each security is in an unrealized
loss position. See “Note 4—Investment Securities” for additional information.
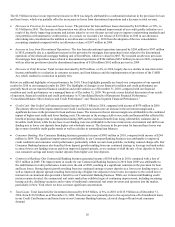
Goodwill and Other Intangible Assets
As a result of our acquisitions, principally Hibernia Corporation in 2005, North Fork Bancorporation in 2006, and Chevy Chase Bank
in 2009, we have goodwill and other intangible assets. Goodwill resulting from business combinations prior to January 1, 2009
represents the excess of the purchase price over the fair value of the net assets of businesses acquired. Goodwill resulting from
business combinations after January 1, 2009, is generally determined as the excess of the fair value of the consideration transferred,
plus the fair value of any noncontrolling interests in the acquiree, over the fair value of the net assets acquired and liabilities assumed
as of the acquisition date. We had goodwill of $13.6 billion recorded on our consolidated balance sheets as of both December 31, 2010
and 2009. Other intangible assets consist primarily of core deposit intangibles. Other intangible assets, which we report on our
consolidated balance sheets as a component of other assets, totaled $733 million and $906 million as of December 31, 2010 and 2009,
respectively. Goodwill and other intangible assets together represented 7% of our total assets as of December 31, 2010, compared with
9% of total assets as of December 31, 2009.
Goodwill is not amortized but must be allocated to reporting units and tested for impairment on an annual basis or in interim periods if
events or circumstances indicate potential impairment. A reporting unit is a business segment or one level below. Our reporting units
for purposes of goodwill impairment testing are Domestic Card, International Card, Auto Finance, other Consumer Banking and
Commercial Banking. We perform our annual goodwill impairment test for all reporting units as of October 1 each year using a two-
step process. First, we compare the fair value of each reporting unit to its current carrying amount, including goodwill.If the fair value
of the reporting unit is in excess of the carrying value, the related goodwill is considered not to be impaired and no further analysis is
necessary. If, however, the carrying value of the reporting unit exceeds the fair value, there is an indication of potential impairment
and a second step of testing is performed to measure the amount of impairment, if any, for that reporting unit.
Estimating the fair value of reporting units and the assets, liabilities and intangible assets of a reporting unit is a subjective process that
involves the use of estimates and judgments, particularly related to cash flows, the appropriate discount rates and an applicable control
premium. Management judgment is required to assess whether the carrying value of the reporting unit can be supported by the fair
value of the individual reporting unit. There are widely accepted valuation methodologies, such as the market approach (earnings
multiples and/or transaction multiples) and/or discounted cash flow methods, that are used to estimate the fair value of reporting units.
In applying these methodologies, we utilize a number of factors, including actual operating results, future business plans, economic
projections, and market data. We also may engage an independent valuation specialist to assist in our valuation process.
In estimating the fair value of the reporting units in step one of the goodwill impairment analysis, fair values can be sensitive to
changes in the projected cash flows and assumptions. In some instances, minor changes in the assumptions could impact whether the
fair value of a reporting unit is greater than its carrying amount. Furthermore, a prolonged decrease or increase in a particular
assumption could eventually lead to the fair value of a reporting unit being less than its carrying amount. Also, to the extent step two
of the goodwill analysis is required, changes in the estimated fair values of individual assets and liabilities may impact other estimates
of fair value for assets or liabilities and result in a different amount of implied goodwill, and ultimately the amount of goodwill
impairment, if any.
In conducting our goodwill impairment test for 2010, we determined the fair value of our reporting units using a discounted cash flow
analysis, a form of the income approach. Our discounted cash flow analysis required management to make judgments about future
loan and deposit growth, revenue growth, credit losses, and capital rates. We relied on each reporting unit’s internal cash flow forecast
and calculated a terminal value using a growth rate that reflected the nominal growth rate of the economy as a whole and appropriate
discount rates for the respective reporting units. We adjusted cash flows as necessary to maintain each reporting unit’s equity capital
requirements. The cash flows were discounted to present value using reporting unit specific discount rates that were largely based on