Capital One 2010 Annual Report Download - page 66
Download and view the complete annual report
Please find page 66 of the 2010 Capital One annual report below. You can navigate through the pages in the report by either clicking on the pages listed below, or by using the keyword search tool below to find specific information within the annual report.-
 1
1 -
2
-
3
-
4
-
5
-
6
-
7
-
8
-
9
-
10
-
11
-
12
-
13
-
14
-
15
-
16
-
17
-
18
-
19
-
20
-
21
-
22
-
23
-
24
-
25
-
26
-
27
-
28
-
29
-
30
-
31
-
32
-
33
-
34
-
35
-
36
-
37
-
38
-
39
-
40
-
41
-
42
-
43
-
44
-
45
-
46
-
47
-
48
-
49
-
50
-
51
-
52
-
53
-
54
-
55
-
 56
56 -
 57
57 -
 58
58 -
 59
59 -
 60
60 -
 61
61 -
 62
62 -
 63
63 -
 64
64 -
 65
65 -
 66
66 -
 67
67 -
 68
68 -
 69
69 -
 70
70 -
 71
71 -
 72
72 -
 73
73 -
 74
74 -
 75
75 -
 76
76 -
77
-
78
-
79
-
80
-
81
-
82
-
83
-
84
-
85
-
86
-
87
-
88
-
89
-
90
-
91
-
92
-
93
-
94
-
95
-
96
-
97
-
98
-
99
-
100
-
101
-
102
-
103
-
104
-
105
-
106
-
107
-
108
-
109
-
110
-
111
-
112
-
113
-
114
-
115
-
116
-
117
-
118
-
119
-
120
-
121
-
122
-
123
-
124
-
125
-
126
-
127
-
128
-
129
-
130
-
131
-
132
-
133
-
134
-
135
-
136
-
137
-
138
-
139
-
140
-
141
-
142
-
143
-
144
-
145
-
146
-
147
-
148
-
149
-
150
-
151
-
152
-
153
-
154
-
155
-
156
-
157
-
158
-
159
-
160
-
161
-
162
-
163
-
164
-
165
-
166
-
167
-
168
-
169
-
170
-
171
-
172
-
173
-
174
-
175
-
176
-
177
-
178
-
179
-
180
-
181
-
182
-
183
-
184
-
185
-
186
-
187
-
188
-
189
-
190
-
191
-
192
-
193
-
194
-
195
-
196
-
197
-
198
-
199
-
200
-
201
-
202
-
203
-
204
-
205
-
206
-
207
-
208
-
209
-
210
-
211
-
212
-
213
-
214
-
215
-
216
-
217
-
218
-
219
-
220
-
221
-
222
-
223
-
224
-
225
-
226
 |
 |

46
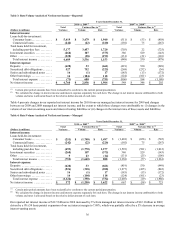
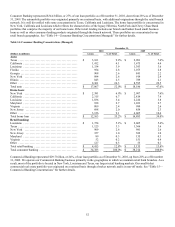
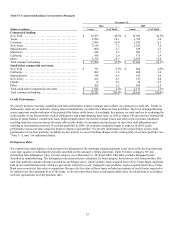
● Deposits: Period-end deposits increased by $12.4 billion, or 20%, to $74.1 as of December 31, 2009, primarily due to the
acquisition of Chevy Chase Bank.
● Charge-off and Delinquency Statistics: The improvement in the net charge-off rate of 2.74% in 2009, compared with 3.09% in
2008 was primarily driven by more positive credit performance in the auto business resulting from a larger proportion of higher
quality loans originated in 2008 and 2009 and improvements in auto auction recovery price. The 30+ day performing delinquency
rate also declined to 5.06% as of December 31, 2009, from 6.31% as of December 31, 2008.
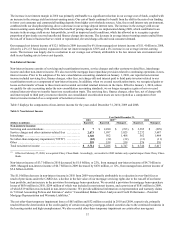
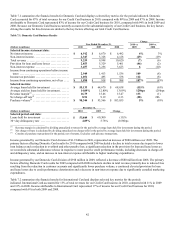
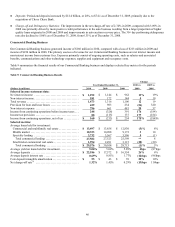
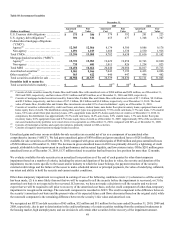
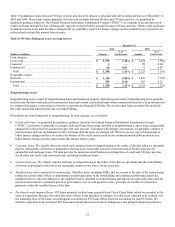
Commercial Banking Business
Our Commercial Banking business generated income of $160 million in 2010, compared with a loss of $213 million in 2009 and
income of $254 million in 2008. The primary sources of revenue for our Commercial Banking business are net interest income and
non-interest income from customer fees. Expenses primarily consist of ongoing operating costs, such as salaries and associated
benefits, communications and other technology expenses, supplies and equipment and occupancy costs.
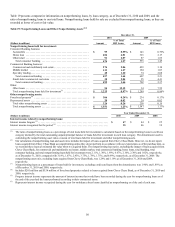
Table 9 summarizes the financial results of our Commercial Banking business and displays selected key metrics for the periods
indicated.
Table 9: Commercial Banking Business Results
Change
Year Ended December 31, 2010 vs. 2009 vs.
(Dollars in millions) 2010 2009 2008 2009 2008
Selected income statement data:
N
et interest income ...................................
.
$ 1,292 $ 1,144 $ 962 13% 19%
N
on-interest income ...................................
.
181 172 144 5 19
Total revenue .........................................
.
1,473 1,316 1,106 12 19
Provision for loan and lease losses ......................
.
429 983 234 (56) 320
N
on-interest expense ..................................
.
796 661 481 20 37
Income from continuing operations before income taxes . .
.
248 (328) 391 176 (184)
Income tax provision ..................................
.
88 (115) 137 177 (184)
Income from continuing operations, net of tax ...........
.
$ 160 $ (213) $ 254 175% (184)%
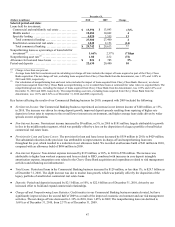
Selected metrics:
Average loans held for investment:
Commercial and multifamily real estate ...............
.
$ 13,497 $ 13,858 $ 12,830 (3)% 8%
Middle market ......................................
.
10,353 10,098 9,172 3 10
Specialty lending ...................................
.
3,732 3,567 3,596 5 (1)
Total commercial lending ..........................
.
27,582 27,523 25,598 ** 8
Small-ticket commercial real estate ...................
.
1,994 2,491 3,115 (20) (20)
Total commercial banking .........................
.
$ 29,576 $ 30,014 $ 28,713 (1)% 5%
Average yield on loans held for investment ..............
.
5.06% 5.02% 5.89% 4 bps (87)bps
Average deposits ......................................
.
$ 22,186 $ 17,572 $ 16,554 26% 6%
Average deposit interest rate ...........................
.
0.69% 0.81% 1.77% (12 )bps (96)bps
Core deposit intangible amortization ....................
.
$ 55 $ 43 $ 39 28% 10%
N
et charge-off rate(1) ..................................
.
1.32% 1.45% 0.29% (13)bps 116 bps