Capital One 2010 Annual Report Download - page 93
Download and view the complete annual report
Please find page 93 of the 2010 Capital One annual report below. You can navigate through the pages in the report by either clicking on the pages listed below, or by using the keyword search tool below to find specific information within the annual report.-
 1
1 -
2
-
3
-
4
-
5
-
6
-
7
-
8
-
9
-
10
-
11
-
12
-
13
-
14
-
15
-
16
-
17
-
18
-
19
-
20
-
21
-
22
-
23
-
24
-
25
-
26
-
27
-
28
-
29
-
30
-
31
-
32
-
33
-
34
-
35
-
36
-
37
-
38
-
39
-
40
-
41
-
42
-
43
-
44
-
45
-
46
-
47
-
48
-
49
-
50
-
51
-
52
-
53
-
54
-
55
-
56
-
57
-
58
-
59
-
60
-
61
-
62
-
63
-
64
-
65
-
66
-
67
-
68
-
69
-
70
-
71
-
72
-
73
-
74
-
75
-
76
-
77
-
78
-
79
-
80
-
81
-
82
-
 83
83 -
 84
84 -
 85
85 -
 86
86 -
 87
87 -
 88
88 -
 89
89 -
 90
90 -
 91
91 -
 92
92 -
 93
93 -
 94
94 -
 95
95 -
 96
96 -
 97
97 -
 98
98 -
 99
99 -
 100
100 -
 101
101 -
 102
102 -
 103
103 -
104
-
105
-
106
-
107
-
108
-
109
-
110
-
111
-
112
-
113
-
114
-
115
-
116
-
117
-
118
-
119
-
120
-
121
-
122
-
123
-
124
-
125
-
126
-
127
-
128
-
129
-
130
-
131
-
132
-
133
-
134
-
135
-
136
-
137
-
138
-
139
-
140
-
141
-
142
-
143
-
144
-
145
-
146
-
147
-
148
-
149
-
150
-
151
-
152
-
153
-
154
-
155
-
156
-
157
-
158
-
159
-
160
-
161
-
162
-
163
-
164
-
165
-
166
-
167
-
168
-
169
-
170
-
171
-
172
-
173
-
174
-
175
-
176
-
177
-
178
-
179
-
180
-
181
-
182
-
183
-
184
-
185
-
186
-
187
-
188
-
189
-
190
-
191
-
192
-
193
-
194
-
195
-
196
-
197
-
198
-
199
-
200
-
201
-
202
-
203
-
204
-
205
-
206
-
207
-
208
-
209
-
210
-
211
-
212
-
213
-
214
-
215
-
216
-
217
-
218
-
219
-
220
-
221
-
222
-
223
-
224
-
225
-
226
 |
 |

73
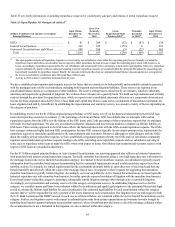
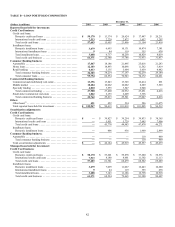
Table 30 provides a summary of the future maturities of large denomination time deposits. Our funding and liquidity planning factors
in the maturities of these deposits. Based on past activity, we expect to retain a portion of these deposits as they mature. Therefore, the
expected net cash outflow will be less than reported in the summary table.
Table 30: Maturities of Large Domestic Denomination Certificates—$100,000 or More
December 31,
2010 2009
(Dollars in millions) Balance Percent Balance Percent
Three months or less ..........................................
.
$ 707 10.9% $ 1,464 16.6%
Over 3 through 6 months ......................................
.
650 10.0 1,273 14.4
Over 6 through 12 months .....................................
.
1,612 24.9 1,623 18.4
Over 12 months through 10 years ...............................
.
3,508 54.2 4,467 50.6
Total .........................................................
.
$ 6,477 100.0% $ 8,827 100.0%
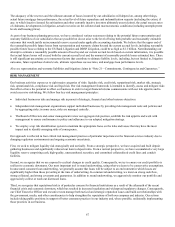
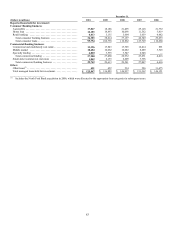
Table 31 provides a summary of the composition of period end, average deposits, interest expense and the average deposit rate paid
for the periods presented.
Table 31: Deposit Composition and Average Deposit Rates
December 31, 2010
(Dollars in millions) Period End
Balance Average
Balance Interest
Expense
% of
Average
Deposits
Average
Deposit
Rate
N
on-interest bearing ............................ $ 15,048 $ 14,267 N/A 12.0% N/A
N
OW accounts ................................ 13,536 12,032 $ 36 10.1 0.30%
Money market deposit accounts ................. 44,485 42,159 409 35.4 0.97
Savings accounts ............................... 26,077 21,854 188 18.4 0.86
Other consumer time deposits ................... 15,753 20,655 585 17.4 2.83
Total core deposits ............................. 114,899 110,967 1,218 93.3 1.10
Public fund certificates of deposit of $100,000 or
more ........................................ 177 265 5 0.2 2.03
Certificates of deposit of $100,000 or more ....... 6,300 6,912 237 5.8 3.43
Foreign time deposits ........................... 834 866 5 0.7 0.57
Total deposits .................................. $ 122,210 $ 119,010 $ 1,465 100.0% 1.23%
December 31, 2009
(Dollars in millions) Period End
Balance Average
Balance Interest
Expense
% of
Average
Deposits
Average
Deposit
Rate
N
on-interest bearing ............................ $ 13,439 $ 12,523 N/A 10.8% N/A
N
OW accounts ................................ 12,077 10,690 $ 60 9.3 0.57%
Money market deposit accounts ................. 38,094 35,055 412 30.3 1.18
Savings accounts ............................... 17,019 11,340 79 9.8 0.69
Other consumer time deposits ................... 25,456 32,736 1,113 28.3 3.40
Total core deposits ............................. 106,085 102,344 1,664 88.5 1.63
Public fund certificates of deposit of $100,000 or
more ........................................ 579 1,034 13 0.9 1.31
Certificates of deposit of $100,000 or more ....... 8,248 10,367 385 9.0 3.71
Foreign time deposits ........................... 897 1,856 31 1.6 1.66
Total deposits .................................. $ 115,809 $ 115,601 $ 2,093 100.0% 1.81%
Short-Term Borrowings
We also have access to and utilize various other short term borrowings to support our operations. These borrowings are generally in
the form of federal funds purchased and resale agreements, most of which are overnight borrowings. Other short term borrowings are
not a significant portion of our overall funding. Table 32 provides summary information about the amounts borrowed and rates paid
on other short term borrowings.