Capital One 2010 Annual Report Download - page 181
Download and view the complete annual report
Please find page 181 of the 2010 Capital One annual report below. You can navigate through the pages in the report by either clicking on the pages listed below, or by using the keyword search tool below to find specific information within the annual report.-
 1
1 -
2
-
3
-
4
-
5
-
6
-
7
-
8
-
9
-
10
-
11
-
12
-
13
-
14
-
15
-
16
-
17
-
18
-
19
-
20
-
21
-
22
-
23
-
24
-
25
-
26
-
27
-
28
-
29
-
30
-
31
-
32
-
33
-
34
-
35
-
36
-
37
-
38
-
39
-
40
-
41
-
42
-
43
-
44
-
45
-
46
-
47
-
48
-
49
-
50
-
51
-
52
-
53
-
54
-
55
-
56
-
57
-
58
-
59
-
60
-
61
-
62
-
63
-
64
-
65
-
66
-
67
-
68
-
69
-
70
-
71
-
72
-
73
-
74
-
75
-
76
-
77
-
78
-
79
-
80
-
81
-
82
-
83
-
84
-
85
-
86
-
87
-
88
-
89
-
90
-
91
-
92
-
93
-
94
-
95
-
96
-
97
-
98
-
99
-
100
-
101
-
102
-
103
-
104
-
105
-
106
-
107
-
108
-
109
-
110
-
111
-
112
-
113
-
114
-
115
-
116
-
117
-
118
-
119
-
120
-
121
-
122
-
123
-
124
-
125
-
126
-
127
-
128
-
129
-
130
-
131
-
132
-
133
-
134
-
135
-
136
-
137
-
138
-
139
-
140
-
141
-
142
-
143
-
144
-
145
-
146
-
147
-
148
-
149
-
150
-
151
-
152
-
153
-
154
-
155
-
156
-
157
-
158
-
159
-
160
-
161
-
162
-
163
-
164
-
165
-
166
-
167
-
168
-
169
-
170
-
 171
171 -
 172
172 -
 173
173 -
 174
174 -
 175
175 -
 176
176 -
 177
177 -
 178
178 -
 179
179 -
 180
180 -
 181
181 -
 182
182 -
 183
183 -
 184
184 -
 185
185 -
 186
186 -
 187
187 -
 188
188 -
 189
189 -
 190
190 -
 191
191 -
192
-
193
-
194
-
195
-
196
-
197
-
198
-
199
-
200
-
201
-
202
-
203
-
204
-
205
-
206
-
207
-
208
-
209
-
210
-
211
-
212
-
213
-
214
-
215
-
216
-
217
-
218
-
219
-
220
-
221
-
222
-
223
-
224
-
225
-
226
 |
 |

CAPITAL ONE FINANCIAL CORPORATION
NOTES TO CONSOLIDATED STATEMENTS
161
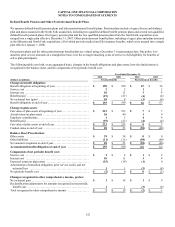
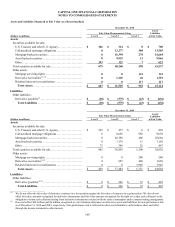
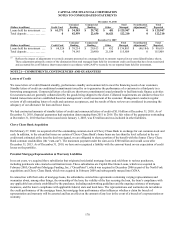
The determination of the classification of financial instruments in Level 2 or Level 3 of the fair value hierarchy is performed at the end
of each reporting period. We consider all available information, including observable market data, indications of market liquidity and
orderliness, and our understanding of the valuation techniques and significant inputs. Based upon the specific facts and circumstances
of each instrument or instrument category, judgments are made regarding the significance of the Level 3 inputs to the instruments’ fair
value measurement in its entirety. If Level 3 inputs are considered significant, the instrument is classified as Level 3. The process for
determining fair value using unobservable inputs is generally more subjective and involves a high degree of management judgment
and assumptions.
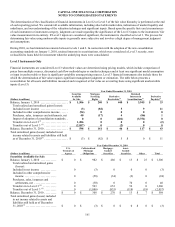
During 2010, we had minimal movements between Levels 1 and 2. In connection with the adoption of the new consolidation
accounting standards on January 1, 2010, retained interests in securitizations, which were considered a Level 3 security, were
reclassified to loans held for investment when the underlying trusts were consolidated.
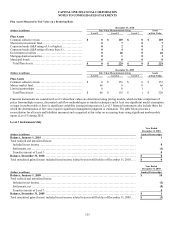
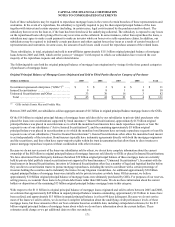
Level 3 Instruments Only
Financial instruments are considered Level 3 when their values are determined using pricing models, which include comparison of
prices from multiple sources, discounted cash flow methodologies or similar techniques and at least one significant model assumption
or input is unobservable or there is significant variability among pricing sources. Level 3 financial instruments also include those for
which the determination of fair value requires significant management judgment or estimation. The table below presents a
reconciliation for all assets and liabilities measured and recognized at fair value on a recurring basis using significant unobservable
inputs (Level 3).
Year Ended December 31, 2010
(Dollars in millions)
Securities
Available
for Sale
Mortgage
Servicing
Rights Derivative
Receivables(2)
Retained
Interests in
Securitizations(3) Derivative
Payables(2)
Balance, January 1, 2010 ...................... $ 1,506 $ 240 $ 440 $ 3,945 $ 33
Total realized and unrealized gains (losses):
Included in net income ...................... (3) (82) 5 9 11
Included in other comprehensive income ...... (94) 0 0 0 0
Purchases, sales, issuances and settlements, net 40 (17) 4 (86) 1
Impact of adoption of consolidation standards . . 0 0 (401) (3,751) 0
Transfers in to Level 3(4) ..................... 1,206 0 0 0 (2)
Transfers out of Level 3 (4) ................... (2,057) 0 (2) 0 0
Balance, December 31, 2010 ................... $ 598 $ 141 $ 46 $ 117 $ 43
Total unrealized gains (losses) included in net
income related to assets and liabilities still held
as of December 31, 2010(5) ................... $ (3) $ (82) $ 5 $ 0 $ 11
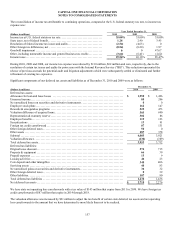
Year Ended December 31, 2010
(Dollars in millions)
U.S.
Treasury &
Agency
Collateralized
Mortgage
Obligations
Mortgage-
backed
Securities
Asset-
backed
Securities Other Total
Securities Available for Sale
Balance, January 1, 2010 ............. $ 0 $ 982 $ 486 $ 13 $ 25 $ 1,506
Total realized and unrealized gains
(losses):
Included in net income ............. 0 (3) 0 0 0 (3)
Included in other comprehensive
income .......................... 0 (58) (34) (2) 0 (94)
Purchases, sales, issuances and
settlements, net .................. 0 (30) 0 70 0 40
Transfers in to Level 3 (4) ........... 0 503 653 50 0 1,206
Transfers out of Level 3 (4) .......... 0 (1,086) (835) (118) (18) (2,057)
Balance, December 31, 2010 .......... $ 0 $ 308 $ 270 $ 13 $ 7 $ 598
Total unrealized gains (losses) included
in net income related to assets and
liabilities still held as of December
31, 2010(5) ......................... $ 0 $ (3) $ 0 $ 0 $ 0 $ (3)