Capital One 2010 Annual Report Download - page 38
Download and view the complete annual report
Please find page 38 of the 2010 Capital One annual report below. You can navigate through the pages in the report by either clicking on the pages listed below, or by using the keyword search tool below to find specific information within the annual report.-
 1
1 -
2
-
3
-
4
-
5
-
6
-
7
-
8
-
9
-
10
-
11
-
12
-
13
-
14
-
15
-
16
-
17
-
18
-
19
-
20
-
21
-
22
-
23
-
24
-
25
-
26
-
27
-
 28
28 -
 29
29 -
 30
30 -
 31
31 -
 32
32 -
 33
33 -
 34
34 -
 35
35 -
 36
36 -
 37
37 -
 38
38 -
 39
39 -
 40
40 -
 41
41 -
 42
42 -
 43
43 -
 44
44 -
 45
45 -
 46
46 -
 47
47 -
 48
48 -
49
-
50
-
51
-
52
-
53
-
54
-
55
-
56
-
57
-
58
-
59
-
60
-
61
-
62
-
63
-
64
-
65
-
66
-
67
-
68
-
69
-
70
-
71
-
72
-
73
-
74
-
75
-
76
-
77
-
78
-
79
-
80
-
81
-
82
-
83
-
84
-
85
-
86
-
87
-
88
-
89
-
90
-
91
-
92
-
93
-
94
-
95
-
96
-
97
-
98
-
99
-
100
-
101
-
102
-
103
-
104
-
105
-
106
-
107
-
108
-
109
-
110
-
111
-
112
-
113
-
114
-
115
-
116
-
117
-
118
-
119
-
120
-
121
-
122
-
123
-
124
-
125
-
126
-
127
-
128
-
129
-
130
-
131
-
132
-
133
-
134
-
135
-
136
-
137
-
138
-
139
-
140
-
141
-
142
-
143
-
144
-
145
-
146
-
147
-
148
-
149
-
150
-
151
-
152
-
153
-
154
-
155
-
156
-
157
-
158
-
159
-
160
-
161
-
162
-
163
-
164
-
165
-
166
-
167
-
168
-
169
-
170
-
171
-
172
-
173
-
174
-
175
-
176
-
177
-
178
-
179
-
180
-
181
-
182
-
183
-
184
-
185
-
186
-
187
-
188
-
189
-
190
-
191
-
192
-
193
-
194
-
195
-
196
-
197
-
198
-
199
-
200
-
201
-
202
-
203
-
204
-
205
-
206
-
207
-
208
-
209
-
210
-
211
-
212
-
213
-
214
-
215
-
216
-
217
-
218
-
219
-
220
-
221
-
222
-
223
-
224
-
225
-
226
 |
 |

18
Goochland County, Virginia which contains nearly 1.2 million square feet of office space to house various business and staff groups.
Additionally, we own 72 acres of land in Plano, Texas which includes nearly 600,000 square feet of office space to support our Auto
Finance business and other functions. Our Commercial and Consumer Banking segments utilize approximately 4.0 million square feet
in owned properties and 5.1 million square feet in leased locations across the District of Columbia, Louisiana, New Jersey, Maryland,
New York, Texas and Virginia for office and branch operations.
Our corporate real estate portfolio also includes leased or owned space totaling, in the aggregate, 2.7 million square feet in Richmond,
Toronto, Melville, New York City and various other locations.
Item 3. Legal Proceedings
The information required by Item 3 is included in “Note 21—Commitments, Contingencies and Guarantees.”
Item 4. Removed and Reserved
PART II
Item 5. Market for Registrant’s Common Equity, Related Stockholder Matters and Issuer Purchases of Equity Securities
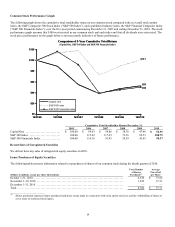
Market Information
Our common stock is listed on the NYSE and is traded under the symbol “COF.” As of January 31, 2011, there were 16,065 holders of
record of our common stock. The table below presents the high and low closing sales prices of our common stock as reported by the
NYSE and cash dividends per common share declared by us during each quarter indicated.
Sales Price Cash
Dividends
Quarter Ended High Low
2010:
December 31 ..................................................................
.
$ 42.78 $ 36.55 $ 0.05
September 30 .................................................................
.
45.00 37.12 0.05
June 30 .......................................................................
.
46.73 38.02 0.05
March 31 ......................................................................
.
43.02 34.63 0.05
2009:
December 31 ..................................................................
.
$ 41.05 $ 33.19 $ 0.05
September 30 ..................................................................
.
39.00 20.47 0.05
June 30 .......................................................................
.
31.34 12.81 0.05
March 31 ......................................................................
.
34.14 8.31 0.38
Dividend Restrictions
For information regarding our ability to pay dividends, see the discussion under “Item 1. Business—Supervision and Regulation—
Dividends and Transfers of Funds,” “MD&A—Liquidity and Capital Management—Dividend Policy,” and “Note 13—Regulatory
and Capital Adequacy,” which we incorporate here by reference.
Securities Authorized for Issuance Under Equity Compensation Plans
Information relating to compensation plans under which our equity securities are authorized for issuance is presented in Part III of this
report under “Item 12. Security Ownership of Certain Beneficial Owners and Management and Related Stockholder Matters.”