Capital One 2010 Annual Report Download - page 102
Download and view the complete annual report
Please find page 102 of the 2010 Capital One annual report below. You can navigate through the pages in the report by either clicking on the pages listed below, or by using the keyword search tool below to find specific information within the annual report.-
 1
1 -
2
-
3
-
4
-
5
-
6
-
7
-
8
-
9
-
10
-
11
-
12
-
13
-
14
-
15
-
16
-
17
-
18
-
19
-
20
-
21
-
22
-
23
-
24
-
25
-
26
-
27
-
28
-
29
-
30
-
31
-
32
-
33
-
34
-
35
-
36
-
37
-
38
-
39
-
40
-
41
-
42
-
43
-
44
-
45
-
46
-
47
-
48
-
49
-
50
-
51
-
52
-
53
-
54
-
55
-
56
-
57
-
58
-
59
-
60
-
61
-
62
-
63
-
64
-
65
-
66
-
67
-
68
-
69
-
70
-
71
-
72
-
73
-
74
-
75
-
76
-
77
-
78
-
79
-
80
-
81
-
82
-
83
-
84
-
85
-
86
-
87
-
88
-
89
-
90
-
91
-
 92
92 -
 93
93 -
 94
94 -
 95
95 -
 96
96 -
 97
97 -
 98
98 -
 99
99 -
 100
100 -
 101
101 -
 102
102 -
 103
103 -
 104
104 -
 105
105 -
 106
106 -
 107
107 -
 108
108 -
 109
109 -
 110
110 -
 111
111 -
 112
112 -
113
-
114
-
115
-
116
-
117
-
118
-
119
-
120
-
121
-
122
-
123
-
124
-
125
-
126
-
127
-
128
-
129
-
130
-
131
-
132
-
133
-
134
-
135
-
136
-
137
-
138
-
139
-
140
-
141
-
142
-
143
-
144
-
145
-
146
-
147
-
148
-
149
-
150
-
151
-
152
-
153
-
154
-
155
-
156
-
157
-
158
-
159
-
160
-
161
-
162
-
163
-
164
-
165
-
166
-
167
-
168
-
169
-
170
-
171
-
172
-
173
-
174
-
175
-
176
-
177
-
178
-
179
-
180
-
181
-
182
-
183
-
184
-
185
-
186
-
187
-
188
-
189
-
190
-
191
-
192
-
193
-
194
-
195
-
196
-
197
-
198
-
199
-
200
-
201
-
202
-
203
-
204
-
205
-
206
-
207
-
208
-
209
-
210
-
211
-
212
-
213
-
214
-
215
-
216
-
217
-
218
-
219
-
220
-
221
-
222
-
223
-
224
-
225
-
226
 |
 |

82
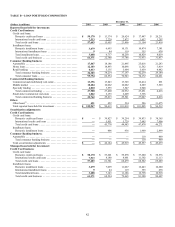
TABLE B—LOAN PORTFOLIO COMPOSITION
December 31,
(Dollars in millions) 2010 2009 2008 2007 2006
Reported loans held for investment:
Credit Card business:
Credit card loans:
Domestic credit card loans ........................... $ 50,170 $ 13,374 $ 20,624 $ 17,447 $ 20,211
International credit card loans ......................... 7,513 2,229 2,872 3,657 3,207
Total credit card loans ............................... 57,683 15,603 23,496 21,104 23,418
Installment loans:
Domestic installment loans ........................... 3,679 6,693 10,131 10,474 7,381
International installment loans ........................ 9 44 119 355 638
Total installment loans ............................... 3,688 6,737 10,250 10,829 8,019
Total credit card business ............................ 61,371 22,340 33,746 31,933 31,437
Consumer Banking business:
Automobile .......................................... 17,867 18,186 21,495 25,018 21,283
Home loans .......................................... 12,103 14,893 10,098 11,562 3,419
Retail banking ....................................... 4,413 5,135 5,604 5,659 4,482
Total consumer banking business ...................... 34,383 38,214 37,197 42,239 29,184
Total consumer loans ................................ 95,754 60,554 70,943 74,172 60,621
Commercial Banking business:
Commercial and multifamily real estate ................... 13,396 13,843 13,303 12,414 891
Middle market ....................................... 10,484 10,062 10,082 8,289 3,525
Specialty lending ..................................... 4,020 3,555 3,547 2,948
—
Total commercial lending ............................ 27,900 27,460 26,932 23,651 4,416
Small-ticket commercial real estate ...................... 1,842 2,153 2,609 3,396
—
Total commercial banking business .................... 29,742 29,613 29,541 27,047 4,416
Other:
Other loans
(
1
)
......................................... 451 452 534 586 31,475
Total reported loans held for investment .................. $ 125,947 $ 90,619 $ 101,018 $ 101,805 $ 96,512
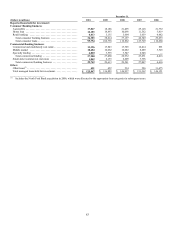
Securitization adjustments:
Credit Card business:
Credit card loans:
Domestic credit card loans ........................... $
—
$ 39,827 $ 39,254 $ 39,833 $ 38,365
International credit card loans .........................
—
5,951 5,729 7,645 7,906
Total credit card loans ...............................
—
45,778 44,983 47,478 46,271
Installment loans:
Domestic installment loans ...........................
—
406 936 1,969 2,899
Consumer Banking business:
Automobile ..........................................
—
—
—
110 469
Total consumer banking business ......................
—
—
—
110 469
Total securitization adjustments ......................... $
—
$ 46,184 $ 45,919 $ 49,557 $ 49,639
Managed loans held for investment:
Credit Card business:
Credit card loans:
Domestic credit card loans ........................... $ 50,170 $ 53,201 $ 59,878 $ 57,280 $ 58,576
International credit card loans ......................... 7,513 8,180 8,601 11,302 11,113
Total credit card loans ............................... 57,683 61,381 68,479 68,582 69,689
Installment loans:
Domestic installment loans ........................... 3,679 7,099 11,067 12,443 10,280
International installment loans ........................ 9 44 119 355 638
Total installment loans ............................... 3,688 7,143 11,186 12,798 10,918
Total credit card business ............................ 61,371 68,524 79,665 81,380 80,607