Capital One 2010 Annual Report Download - page 169
Download and view the complete annual report
Please find page 169 of the 2010 Capital One annual report below. You can navigate through the pages in the report by either clicking on the pages listed below, or by using the keyword search tool below to find specific information within the annual report.-
 1
1 -
2
-
3
-
4
-
5
-
6
-
7
-
8
-
9
-
10
-
11
-
12
-
13
-
14
-
15
-
16
-
17
-
18
-
19
-
20
-
21
-
22
-
23
-
24
-
25
-
26
-
27
-
28
-
29
-
30
-
31
-
32
-
33
-
34
-
35
-
36
-
37
-
38
-
39
-
40
-
41
-
42
-
43
-
44
-
45
-
46
-
47
-
48
-
49
-
50
-
51
-
52
-
53
-
54
-
55
-
56
-
57
-
58
-
59
-
60
-
61
-
62
-
63
-
64
-
65
-
66
-
67
-
68
-
69
-
70
-
71
-
72
-
73
-
74
-
75
-
76
-
77
-
78
-
79
-
80
-
81
-
82
-
83
-
84
-
85
-
86
-
87
-
88
-
89
-
90
-
91
-
92
-
93
-
94
-
95
-
96
-
97
-
98
-
99
-
100
-
101
-
102
-
103
-
104
-
105
-
106
-
107
-
108
-
109
-
110
-
111
-
112
-
113
-
114
-
115
-
116
-
117
-
118
-
119
-
120
-
121
-
122
-
123
-
124
-
125
-
126
-
127
-
128
-
129
-
130
-
131
-
132
-
133
-
134
-
135
-
136
-
137
-
138
-
139
-
140
-
141
-
142
-
143
-
144
-
145
-
146
-
147
-
148
-
149
-
150
-
151
-
152
-
153
-
154
-
155
-
156
-
157
-
158
-
 159
159 -
 160
160 -
 161
161 -
 162
162 -
 163
163 -
 164
164 -
 165
165 -
 166
166 -
 167
167 -
 168
168 -
 169
169 -
 170
170 -
 171
171 -
 172
172 -
 173
173 -
 174
174 -
 175
175 -
 176
176 -
 177
177 -
 178
178 -
 179
179 -
180
-
181
-
182
-
183
-
184
-
185
-
186
-
187
-
188
-
189
-
190
-
191
-
192
-
193
-
194
-
195
-
196
-
197
-
198
-
199
-
200
-
201
-
202
-
203
-
204
-
205
-
206
-
207
-
208
-
209
-
210
-
211
-
212
-
213
-
214
-
215
-
216
-
217
-
218
-
219
-
220
-
221
-
222
-
223
-
224
-
225
-
226
 |
 |

CAPITAL ONE FINANCIAL CORPORATION
NOTES TO CONSOLIDATED STATEMENTS
149
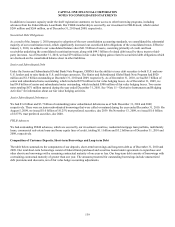
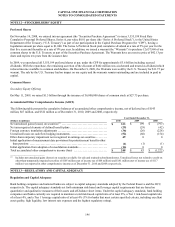
The following table provides the number of reserved common shares and the number of common shares available for future issuance
for our active stock-based compensation plan as of December 31, 2010 and 2009. The ability to issue grants from the 1999 Non-
Employee Directors Stock Incentive Plan was terminated in 2009.
Available For Issuance
(In thousands) December 31
Plan Name
Shares
Reserved 2010 2009 2008
2004 Stock Incentive Plan ..................................... 40,000(1) 16,225 17,789 4,506
________________________
(1) On April 20, 2009 the Board authorized an increase in shares reserved of 20 million shares to 40 million shares in total.
Generally the exercise price of stock options, or value of restricted stock awards, will equal the fair market value of our common stock
on the date of grant. The maximum contractual term for options is ten years, and option vesting is determined at the time of grant. The
vesting for most options is 33 1/3 percent per year beginning with the first anniversary of the grant date. For restricted stock granted
before 2010, the vesting was usually 25 percent on the first and second anniversaries of the grant date and 50 percent on the third
anniversary date. For restricted stock granted in 2010, the vesting is usually 33 1/3 percent per year beginning with the first
anniversary of the grant date.
We also issue cash equity units which are recorded as liabilities as the expense is recognized. Cash equity units are settled with a cash
payment for each unit vested equal to the average fair market value of our common stock for the 20 trading days preceding the vesting
date. Because they are settled in cash with no opportunity for any shares to be issued at vesting or settlement, cash equity units are not
included in shares reserved or available for issuance. For cash equity units granted before 2010, the vesting was usually 25 percent on
the first and second anniversaries of the grant date and 50 percent on the third anniversary date. For cash equity units granted in 2010,
vesting will usually be 33 1/3 percent per year beginning with the first anniversary of the grant date.
We recognize compensation expense on a straight line basis over the entire award’s vesting period for any awards with graded vesting
attributes. Total compensation expense recognized for stock-based compensation during the years 2010, 2009 and 2008 was $149
million, $146 million and $112 million, respectively. The total income tax benefit recognized in the consolidated statement of income
for stock-based compensation arrangements during the years 2010, 2009 and 2008 was $52 million, $51 million and $39 million,
respectively.
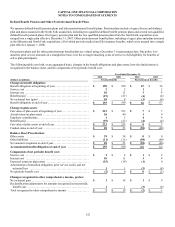
Stock option expense is based on the fair value per stock option, estimated at the grant date using a Black-Scholes option-pricing
model. The fair value of stock options granted during 2010, 2009 and 2008 was estimated using the weighted average assumptions
summarized below:
Year Ended December 31,
Assumptions 2010 2009 2008
Dividend yield (1) ..............................................................
.
1.49% 4.79% 3.20%
Volatility factors of stock’s expected market price ...............................
.
38 43 28
Risk-free interest rate ..........................................................
.
2.49 1.79 2.89
Expected option lives (in years) ................................................
.
5.0 5.0 5.0
________________________
(1) In 2010, 2009, and 2008, we paid dividends at the annual rate of $0.20, $0.53, and $1.50 per share, respectively.
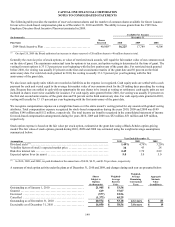
A summary of stock option activity under the plans as of December 31, 2010 and 2009, and changes during each year are presented below:
Shares
Subject to
Options
(in thousands)
Weighted-
Average
Exercise
Price
Weighted-
Average
Remaining
Contractual
Term
Aggregate
Intrinsic
Value
(in millions)
Outstanding as of January 1, 2010 ........................... 21,905 $ 53.58
Granted ................................................... 619 37.07
Exercised ................................................. (577) 22.56
Cancelled ................................................. (1,373) 65.29
Outstanding as of December 31, 2010 ....................... 20,574 $ 53.18 4.6 years $ 83
Exercisable as of December 31, 2010 ........................ 16,050 $ 58.56 3.8 years $ 19