Capital One 2010 Annual Report Download - page 57
Download and view the complete annual report
Please find page 57 of the 2010 Capital One annual report below. You can navigate through the pages in the report by either clicking on the pages listed below, or by using the keyword search tool below to find specific information within the annual report.-
 1
1 -
2
-
3
-
4
-
5
-
6
-
7
-
8
-
9
-
10
-
11
-
12
-
13
-
14
-
15
-
16
-
17
-
18
-
19
-
20
-
21
-
22
-
23
-
24
-
25
-
26
-
27
-
28
-
29
-
30
-
31
-
32
-
33
-
34
-
35
-
36
-
37
-
38
-
39
-
40
-
41
-
42
-
43
-
44
-
45
-
46
-
 47
47 -
 48
48 -
 49
49 -
 50
50 -
 51
51 -
 52
52 -
 53
53 -
 54
54 -
 55
55 -
 56
56 -
 57
57 -
 58
58 -
 59
59 -
 60
60 -
 61
61 -
 62
62 -
 63
63 -
 64
64 -
 65
65 -
 66
66 -
 67
67 -
68
-
69
-
70
-
71
-
72
-
73
-
74
-
75
-
76
-
77
-
78
-
79
-
80
-
81
-
82
-
83
-
84
-
85
-
86
-
87
-
88
-
89
-
90
-
91
-
92
-
93
-
94
-
95
-
96
-
97
-
98
-
99
-
100
-
101
-
102
-
103
-
104
-
105
-
106
-
107
-
108
-
109
-
110
-
111
-
112
-
113
-
114
-
115
-
116
-
117
-
118
-
119
-
120
-
121
-
122
-
123
-
124
-
125
-
126
-
127
-
128
-
129
-
130
-
131
-
132
-
133
-
134
-
135
-
136
-
137
-
138
-
139
-
140
-
141
-
142
-
143
-
144
-
145
-
146
-
147
-
148
-
149
-
150
-
151
-
152
-
153
-
154
-
155
-
156
-
157
-
158
-
159
-
160
-
161
-
162
-
163
-
164
-
165
-
166
-
167
-
168
-
169
-
170
-
171
-
172
-
173
-
174
-
175
-
176
-
177
-
178
-
179
-
180
-
181
-
182
-
183
-
184
-
185
-
186
-
187
-
188
-
189
-
190
-
191
-
192
-
193
-
194
-
195
-
196
-
197
-
198
-
199
-
200
-
201
-
202
-
203
-
204
-
205
-
206
-
207
-
208
-
209
-
210
-
211
-
212
-
213
-
214
-
215
-
216
-
217
-
218
-
219
-
220
-
221
-
222
-
223
-
224
-
225
-
226
 |
 |

37
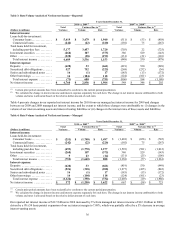
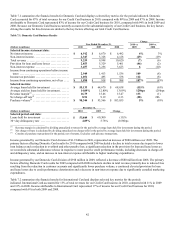
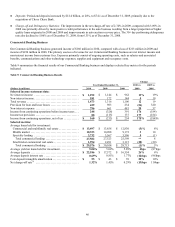
The increase in net interest margin in 2010 was primarily attributable to a significant reduction in our average cost of funds, coupled with
an increase in the average yield on interest-earning assets. Our cost of funds continued to benefit from the shift in the mix of our funding
to lower cost consumer and commercial banking deposits from higher cost wholesale sources. Also, the overall interest rate environment,
combined with our disciplined pricing, drove a decrease in our average deposit interest rates. The increase in the average yield on our
interest-earning assets during 2010 reflected the benefit of pricing changes that we implemented during 2009, which contributed to an
increase in the average yield on our loan portfolio, as well as improved credit conditions, which has allowed us to recognize a greater
proportion of previously reserved uncollected finance charges into income. The decrease in average interest-earning assets resulted from
the run-off of loans in business that we exited or repositioned, elevated charge-offs and weak consumer demand.
Our managed net interest income of $12.1 billion in 2009 increased by 6% from managed net interest income of $11.4 billion in 2008,
driven by a 2% (13 basis points) expansion of our net interest margin to 6.50% and a 4% increase in our average interest-earning
assets. The increase was largely due to a reduction in our average cost of funds, attributable to the low interest rate environment and
shift in our funding mix to lower cost deposits.
Non-Interest Income
Non-interest income consists of servicing and securitizations income, service charges and other customer-related fees, interchange
income and other non-interest income. We also record the mortgage loan repurchase provision related to continuing operations in non-
interest income. Prior to the adoption of the new consolidation accounting standards on January 1, 2010, our reported non-interest
income included servicing fees, finance charges, other fees, net charge-offs and interest paid to third party investors related to our
securitization trusts as a component of non-interest income. In addition, when we created securitization trusts, we recognized gains or
losses on the transfer of loans to these trusts and recorded our initial retained interests in the trusts. Effective January 1, 2010, unless
we qualify for sale accounting under the new consolidation accounting standards, we no longer recognize a gain or loss or record
retained interests when we transfer loans into securitization trusts. The servicing fees, finance charges, other fees, net of charge-offs
and interest paid to third party investors related to our consolidated securitization trusts are now reported as a component of net
interest income instead of as a component of non-interest income.
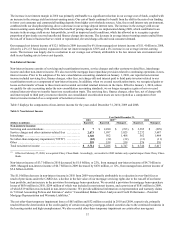
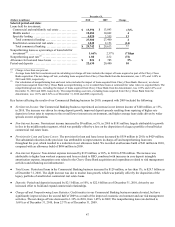
Table 5 displays the components of non-interest income for the years ended December 31, 2010, 2009 and 2008.
Table 5: Non-Interest Income
Year Ended December 31,
2010 2009(1) 2008
(Dollars in millions) Reported Reported Managed Reported Managed
Non-interest income:
Servicing and securitizations ............................. $ 7 $ 2,280 $ (193) $ 3,385 $ (299
)
Service charges and other customer-related fees ........... 2,073 1,997 3,025 2,232 3,687
Interchange ............................................. 1,340 502 1,408 562 1,464
N
et othe
r
-than-temporary impairment (“OTTI”) ........... (65) (32) (32) (11) (11
)
Other .................................................. 359 539 539 576 576
Total non-interest income ................................ $ 3,714 $ 5,286 $ 4,747 $ 6,744 $ 5,417
________________________
(1) Effective February 27, 2009, we acquired Chevy Chase Bank. Accordingly, our results for 2009 include only a partial impact from Chevy Chase
Bank.
Non-interest income of $3.7 billion in 2010 decreased by $1.0 billion, or 22%, from managed non-interest income of $4.7 billion in
2009. Managed non-interest income of $4.7 billion in 2009 decreased by $670 million, or 12%, from managed non-interest income of
$5.4 billion in 2008.
The $1.0 billion decrease in non-interest income in 2010 from 2009 was primarily attributable to a reduction in over-limit fees as
result of provisions under the CARD Act, a decline in the fair value of our mortgage servicing rights due to the run-off of our home
loan portfolio, and an increase in the provision for mortgage loan repurchases. We recorded a provision for mortgage loan repurchase
losses of $636 million in 2010, $204 million of which was included in non-interest income, and a provision of $181 million in 2009,
of which $19 million was included in non-interest income. We provide additional information on representation and warranty claims
in “Critical Accounting Polices and Estimates” and in “Consolidated Balance Sheet Analysis and Credit Performance—Potential
Mortgage Representation and Warranty Liabilities.”
The net other-than-temporary impairment losses of $65 million and $32 million recorded in 2010 and 2009, respectively, primarily
resulted from the deterioration in the credit quality of certain non-agency mortgage-related securities due to the continued weakness in
the housing market and high unemployment. We also recorded other-than-temporary impairment on certain other non-agency