Capital One 2010 Annual Report Download - page 138
Download and view the complete annual report
Please find page 138 of the 2010 Capital One annual report below. You can navigate through the pages in the report by either clicking on the pages listed below, or by using the keyword search tool below to find specific information within the annual report.-
 1
1 -
2
-
3
-
4
-
5
-
6
-
7
-
8
-
9
-
10
-
11
-
12
-
13
-
14
-
15
-
16
-
17
-
18
-
19
-
20
-
21
-
22
-
23
-
24
-
25
-
26
-
27
-
28
-
29
-
30
-
31
-
32
-
33
-
34
-
35
-
36
-
37
-
38
-
39
-
40
-
41
-
42
-
43
-
44
-
45
-
46
-
47
-
48
-
49
-
50
-
51
-
52
-
53
-
54
-
55
-
56
-
57
-
58
-
59
-
60
-
61
-
62
-
63
-
64
-
65
-
66
-
67
-
68
-
69
-
70
-
71
-
72
-
73
-
74
-
75
-
76
-
77
-
78
-
79
-
80
-
81
-
82
-
83
-
84
-
85
-
86
-
87
-
88
-
89
-
90
-
91
-
92
-
93
-
94
-
95
-
96
-
97
-
98
-
99
-
100
-
101
-
102
-
103
-
104
-
105
-
106
-
107
-
108
-
109
-
110
-
111
-
112
-
113
-
114
-
115
-
116
-
117
-
118
-
119
-
120
-
121
-
122
-
123
-
124
-
125
-
126
-
127
-
 128
128 -
 129
129 -
 130
130 -
 131
131 -
 132
132 -
 133
133 -
 134
134 -
 135
135 -
 136
136 -
 137
137 -
 138
138 -
 139
139 -
 140
140 -
 141
141 -
 142
142 -
 143
143 -
 144
144 -
 145
145 -
 146
146 -
 147
147 -
 148
148 -
149
-
150
-
151
-
152
-
153
-
154
-
155
-
156
-
157
-
158
-
159
-
160
-
161
-
162
-
163
-
164
-
165
-
166
-
167
-
168
-
169
-
170
-
171
-
172
-
173
-
174
-
175
-
176
-
177
-
178
-
179
-
180
-
181
-
182
-
183
-
184
-
185
-
186
-
187
-
188
-
189
-
190
-
191
-
192
-
193
-
194
-
195
-
196
-
197
-
198
-
199
-
200
-
201
-
202
-
203
-
204
-
205
-
206
-
207
-
208
-
209
-
210
-
211
-
212
-
213
-
214
-
215
-
216
-
217
-
218
-
219
-
220
-
221
-
222
-
223
-
224
-
225
-
226
 |
 |

CAPITAL ONE FINANCIAL CORPORATION
NOTES TO CONSOLIDATED STATEMENTS
118
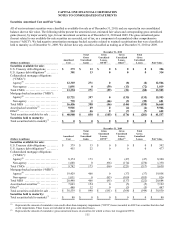
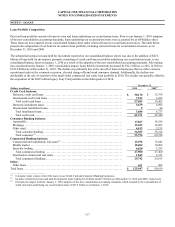
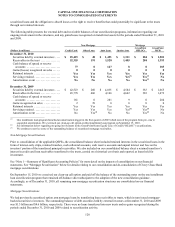
Credit Quality
We closely monitor economic conditions and loan performance trends to manage and evaluate our exposure to credit risk. Trends in
delinquency ratios are an indicator, among other considerations, of credit risk within our loan portfolios. The level of nonperforming
assets represents another indicator of the potential for future credit losses. Accordingly, key metrics we track and use in evaluating the
credit quality of our loan portfolio include delinquency and nonperforming asset rates, as well as charge-off rates and our internal risk
ratings of larger balance, commercial loans. High unemployment, the decline in home prices and other weak economic conditions
resulting from the recent recession adversely affected the ability of consumers and businesses to meet their debt obligations and
resulting in deterioration across all of our loan portfolios in 2009. As economic conditions began to improve in 2010, credit
performance across our loan categories began to improve and stabilize.
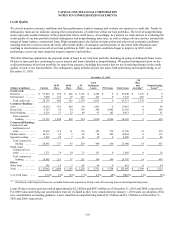
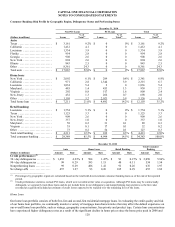
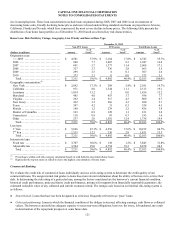
The table following summarizes the payment status of loans in our total loan portfolio, including an aging of delinquent loans, loans
90 days or more past due continuing to accrue interest and loans classified as nonperforming. We present information below on the
credit performance of our loan portfolio, by major loan category, including key metrics that we use in tracking changes in the credit
quality of each of our loan portfolios. The delinquency aging includes all past due loans, both performing and nonperforming, as of
December 31, 2010.
December 31, 2010
(Dollars in millions) Current
30-59
Days
60-89
Days
> 90
Days
Total
Delinquent
Loans PCI Loans Total Loans
> 90
Days
and
Accruing(1)
Nonperforming
Loans(1)
Credit card:
Domestic ............ $ 51,649 $ 558 $ 466 $ 1,176 $ 2,200 $ 0 $ 53,849 $ 1,176 $ 0
International ......... 7,090 132 97 203 432 0 7,522 203 0
Total credit card .... 58,739 690 563 1,379 2,632 0 61,371 1,379 0
Consumer Banking:
Auto ............... 16,414 952 402 99 1,453 0 17,867 0 99
Home loan .......... 6,707 65 44 395 504 4,892 12,103 0 486
Retail banking ....... 4,218 31 22 40 93 102 4,413 5 91
Total consumer
banking ......... 27,339 1,048 468 534 2,050 4,994 34,383 5 676
Commercial Banking:
Commercial and
multifamily real
estate ............. 12,816 118 31 153 302 278 13,396 14 276
Middle market ....... 10,113 34 5 50 89 282 10,484 0 133
Specialty lending ..... 3,962 25 7 26 58 0 4,020 0 48
Total commercial
lending ......... 26,891 177 43 229 449 560 27,900 14 457
Small-ticket
commercial real
estate ............. 1,711 74 24 33 131 0 1,842 0 38
Total commercial
banking ......... 28,602 251 67 262 580 560 29,742 14 495
Other:
Other loans .......... 382 19 5 45 69 0 451 0 54
Total ............... $ 115,062 $ 2,008 $ 1,103 $ 2,220 $ 5,331 $ 5,554 $ 125,947 $ 1,398 $ 1,225
% of Total loans ..... 91.4% 1.6 % 0.9% 1.7% 4.2% 4.4% 100.0% 1.1% 1.0
%
________________________
(1) Purchased credit-impaired loans are excluded from loans reported as 90 days and still accruing interest and nonperforming loans.
Loans 90 days or more past due totaled approximately $2.2 billion and $853 million as of December 31, 2010 and 2009, respectively.
For 2009 loans underlying our securitization trust are excluded as they were consolidated on January 1, 2010 upon our adoption of the
new consolidation accounting guidance. Loans classified as nonperforming totaled $1.2 billion and $1.3 billion as of December 31,
2010 and 2009, respectively.