Capital One 2010 Annual Report Download - page 46
Download and view the complete annual report
Please find page 46 of the 2010 Capital One annual report below. You can navigate through the pages in the report by either clicking on the pages listed below, or by using the keyword search tool below to find specific information within the annual report.-
 1
1 -
2
-
3
-
4
-
5
-
6
-
7
-
8
-
9
-
10
-
11
-
12
-
13
-
14
-
15
-
16
-
17
-
18
-
19
-
20
-
21
-
22
-
23
-
24
-
25
-
26
-
27
-
28
-
29
-
30
-
31
-
32
-
33
-
34
-
35
-
 36
36 -
 37
37 -
 38
38 -
 39
39 -
 40
40 -
 41
41 -
 42
42 -
 43
43 -
 44
44 -
 45
45 -
 46
46 -
 47
47 -
 48
48 -
 49
49 -
 50
50 -
 51
51 -
 52
52 -
 53
53 -
 54
54 -
 55
55 -
 56
56 -
57
-
58
-
59
-
60
-
61
-
62
-
63
-
64
-
65
-
66
-
67
-
68
-
69
-
70
-
71
-
72
-
73
-
74
-
75
-
76
-
77
-
78
-
79
-
80
-
81
-
82
-
83
-
84
-
85
-
86
-
87
-
88
-
89
-
90
-
91
-
92
-
93
-
94
-
95
-
96
-
97
-
98
-
99
-
100
-
101
-
102
-
103
-
104
-
105
-
106
-
107
-
108
-
109
-
110
-
111
-
112
-
113
-
114
-
115
-
116
-
117
-
118
-
119
-
120
-
121
-
122
-
123
-
124
-
125
-
126
-
127
-
128
-
129
-
130
-
131
-
132
-
133
-
134
-
135
-
136
-
137
-
138
-
139
-
140
-
141
-
142
-
143
-
144
-
145
-
146
-
147
-
148
-
149
-
150
-
151
-
152
-
153
-
154
-
155
-
156
-
157
-
158
-
159
-
160
-
161
-
162
-
163
-
164
-
165
-
166
-
167
-
168
-
169
-
170
-
171
-
172
-
173
-
174
-
175
-
176
-
177
-
178
-
179
-
180
-
181
-
182
-
183
-
184
-
185
-
186
-
187
-
188
-
189
-
190
-
191
-
192
-
193
-
194
-
195
-
196
-
197
-
198
-
199
-
200
-
201
-
202
-
203
-
204
-
205
-
206
-
207
-
208
-
209
-
210
-
211
-
212
-
213
-
214
-
215
-
216
-
217
-
218
-
219
-
220
-
221
-
222
-
223
-
224
-
225
-
226
 |
 |
26
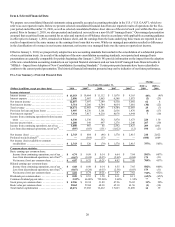
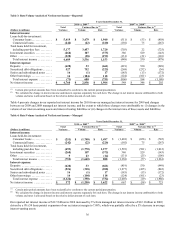
The $1.9 billion increase in our reported net income in 2010 was largely attributable to a substantial reduction in the provision for loan
and lease losses, which was partially offset by an increase in losses from discontinued operations and a decrease in total revenue.
• Decrease in Provision for Loan and Lease Losses: The provision for loan and lease losses decreased by $4.2 billion, or 52%, to
$3.9 billion in 2010. The decrease in the provision was driven by the continued improvement of our credit quality indicators as a
result of the slowly improving economy and actions taken by us over the past several years to improve underwriting standards and
exit portfolios with unattractive credit metrics. As a result, we recorded a net release of $2.8 billion in 2010 in our allowance,
after taking into consideration the addition to our allowance on January 1, 2010 from the adoption of the new consolidation
accounting standards compared with a net allowance release of $397 million in 2009.
• Increase in Loss from Discontinued Operations: The loss from discontinued operations increased by $204 million to $307 million
in 2010, primarily due to a significant increase in the provision for mortgage loan repurchase losses related to the discontinued
operations of the wholesale mortgage banking unit of GreenPoint, which we closed in 2007. We recorded an after-tax provision
for mortgage loan repurchase losses related to discontinued operations of $304 million ($432 million pre-tax) in 2010, compared
with an after-tax provision related to discontinued operations of $120 million ($162 million pre-tax) in 2009.
• Decrease in Total Revenue: Total revenue decreased by $659 million, or 4%, in 2010, largely due to a decline in non-interest fee
income attributable to a reduction in customer accounts, and loan balances and the implementation of provisions of the CARD
Act, which resulted in a reduction in penalty fees.
Below are additional highlights of our performance for 2010. These highlights generally are based on a comparison of our reported
results for 2010 to our managed results for 2009. The highlights of changes in our financial condition and credit performance are
generally based on our reported financial condition and credit statistics as of December 31, 2010, compared with our financial
condition and credit performance on a managed basis as of December 31, 2009. We provide a more detailed discussion of our results
of operation, financial condition and credit performance in “Consolidated Results of Operations Financial Performance,”
“Consolidated Balance Sheet Analysis and Credit Performance” and “Business Segment Financial Performance.”
• Credit Card: Our Credit Card business generated income of $2.3 billion in 2010, compared with income of $978 million in 2009.
The primary drivers of the improvement in our Credit Card business results were an increase in the net interest margin and a
significant decrease in the provision for loan and lease losses. The increase in the net interest margin was attributable to the combined
impact of higher asset yields and lower funding costs. The increase in the average yield on our credit card loan portfolio reflected the
benefit of pricing changes that we implemented during 2009 and the continued benefit from rising collectability estimates due to
favorable credit trends, while the decrease in our funding costs was attributable to the lower interest rate environment and shift in our
funding mix to lower cost deposits from higher cost wholesale sources. The decrease in the provision for loan and lease losses was
due to more favorable credit quality trends as well as a decline in outstanding loan balances.
• Consumer Banking: Our Consumer Banking business generated income of $905 million in 2010, compared with income of $244
million in 2009. The significant improvement in profitability in our Consumer Banking business was attributable to improved
credit conditions and consumer credit performance, particularly within our auto loan portfolio, including reduced charge-offs. Our
Consumer Banking business also benefited from deposit growth resulting from our continued strategy to leverage our bank outlets
to attract lower cost funding sources and from improved deposit spreads, as we continue to shift the mix of our deposits to lower
cost consumer savings and money market deposits from higher cost time deposits.
• Commercial Banking: Our Commercial Banking business generated income of $160 million in 2010, compared with a loss of
$213 million in 2009. The improvement in results for our Commercial Banking business in 2010 from 2009 was attributable to
the stabilization in credit performance trends since the end of 2009, resulting in a significant reduction in the provision for loan
and lease losses. Strong deposit growth resulting from our continued strategy to grow deposits as a lower cost funding source, as
well as improved deposit spreads resulting from repricing of higher rate deposits to lower rates in response to the overall lower
interest rate environment also provided a benefit to our Commercial Banking business. While our Commercial Banking credit
metrics remain elevated, the commercial real estate market has exhibited signs of continuing improvement, including increasing
leasing activity, declining vacancies and re-entry of traditional commercial real estate investors and sponsors into the market,
particularly in New York where we have our most significant concentration.
• Total Loans: Total loans held for investment decreased by $10.9 billion, or 8%, in 2010 to $125.9 billion as of December 31,
2010, from $136.8 billion as of December 31, 2009. This decrease was primarily due to the expected run-off of installment loans
in our Credit Card business and home loans in our Consumer Banking business, elevated charge-offs and weak consumer
demand.