Capital One 2010 Annual Report Download - page 217
Download and view the complete annual report
Please find page 217 of the 2010 Capital One annual report below. You can navigate through the pages in the report by either clicking on the pages listed below, or by using the keyword search tool below to find specific information within the annual report.-
 1
1 -
2
-
3
-
4
-
5
-
6
-
7
-
8
-
9
-
10
-
11
-
12
-
13
-
14
-
15
-
16
-
17
-
18
-
19
-
20
-
21
-
22
-
23
-
24
-
25
-
26
-
27
-
28
-
29
-
30
-
31
-
32
-
33
-
34
-
35
-
36
-
37
-
38
-
39
-
40
-
41
-
42
-
43
-
44
-
45
-
46
-
47
-
48
-
49
-
50
-
51
-
52
-
53
-
54
-
55
-
56
-
57
-
58
-
59
-
60
-
61
-
62
-
63
-
64
-
65
-
66
-
67
-
68
-
69
-
70
-
71
-
72
-
73
-
74
-
75
-
76
-
77
-
78
-
79
-
80
-
81
-
82
-
83
-
84
-
85
-
86
-
87
-
88
-
89
-
90
-
91
-
92
-
93
-
94
-
95
-
96
-
97
-
98
-
99
-
100
-
101
-
102
-
103
-
104
-
105
-
106
-
107
-
108
-
109
-
110
-
111
-
112
-
113
-
114
-
115
-
116
-
117
-
118
-
119
-
120
-
121
-
122
-
123
-
124
-
125
-
126
-
127
-
128
-
129
-
130
-
131
-
132
-
133
-
134
-
135
-
136
-
137
-
138
-
139
-
140
-
141
-
142
-
143
-
144
-
145
-
146
-
147
-
148
-
149
-
150
-
151
-
152
-
153
-
154
-
155
-
156
-
157
-
158
-
159
-
160
-
161
-
162
-
163
-
164
-
165
-
166
-
167
-
168
-
169
-
170
-
171
-
172
-
173
-
174
-
175
-
176
-
177
-
178
-
179
-
180
-
181
-
182
-
183
-
184
-
185
-
186
-
187
-
188
-
189
-
190
-
191
-
192
-
193
-
194
-
195
-
196
-
197
-
198
-
199
-
200
-
201
-
202
-
203
-
204
-
205
-
206
-
 207
207 -
 208
208 -
 209
209 -
 210
210 -
 211
211 -
 212
212 -
 213
213 -
 214
214 -
 215
215 -
 216
216 -
 217
217 -
 218
218 -
 219
219 -
 220
220 -
 221
221 -
 222
222 -
 223
223 -
 224
224 -
 225
225 -
 226
226
 |
 |

Page 2
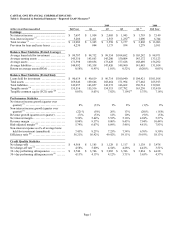
CAPITAL ONE FINANCIAL CORPORATION (COF)
Table 2: Financial & Statistical Summary—Non-GAAP Securitization Reconciliation Adjustments
2009 2008
(dollars in millions)(unaudited) Full Year Q4 Q3 Q2 Q1 Full Year
Earnings
N
et interest income ............................. $ 4,392 $ 1,216 $ 1,207 $ 1,012 $ 957 $ 4,273
N
on-interest income ............................. (539) (213) (180) (42) (104) (1,327)
Total revenue ................................... 3,853 1,003 1,027 970 853 2,946
Provision for loan and lease losses ................ 3,853 1,003 1,027 970 853 2,946
Balance Sheet Statistics (Period Average)
Average loans held for investment ................ $ 43,727 $ 43,452 $ 44,186 $ 43,331 $ 43,940 $ 48,841
Average earning assets .......................... 40,666 40,236 40,594 40,404 41,442 46,264
Average assets .................................. 41,060 40,569 41,227 40,774 41,680 47,262
Average liabilities ............................... 41,060 40,569 41,227 40,774 41,680 47,262
Return on average assets (ROA) .................. (0.12)% (0.18)% (0.20)% (0.10)% 0.04% (0.01)%
Balance Sheet Statistics (Period End)
Loans held for investment ....................... $ 46,184 $ 46,184 $ 44,275 $ 45,177 $ 44,809 $ 45,919
Total assets ..................................... 42,743 42,743 41,219 42,184 42,496 43,962
Total liabilities .................................. 42,767 42,767 41,219 42,184 42,496 43,961
Tangible assets (A) ............................... 42,767 42,767 41,251 42,230 42,526 43,927
Tangible common equity (TCE) ratio (B) .......... (1.73)% (1.73)% (1.65)% (1.50)% (1.19)% (1.61)%
Performance Statistics
N
et interest income growth ...................... (2)% 2% 6%
—
%
—
% (5)%
N
on-interest income growth ...................... 10% (4)% (11)% 8% 3% 10%
Revenue growth ................................ 7%
—
% (1)% 1% 4% 5%
N
et interest margin .............................. 1.20% 1.46% 1.39% 1.03% 0.95% 1.00%
Revenue margin ................................ 0.11% 0.13% 0.07% 0.25% 0.07% (1.05)%
Risk-adjusted margin(C) .......................... (1.26)% (1.33)% (1.46)% (1.15)% (1.07)% (2.02)%
N
on-interest expense as a% of average loans held
for investment (annualized) ...................... (2.26)% (2.59)% (2.23)% (2.15)% (2.02)% (2.75)%
Efficiency ratio (D) ............................... (12.86)% (13.07)% (11.19)% (13.82)% (13.68)% (10.17)%
Credit Quality Statistics
N
et charge-offs ................................. $ 3,853 $ 1,003 $ 1,027 $ 970 $ 853 $ 2,947
N
et charge-off rate .............................. 1.29% 1.33% 1.46% 1.36% 1.00% 0.84%
30+ day performing delinquencies ................ $ 2,719 $ 2,719 $ 2,434 $ 2,241 $ 2,312 $ 2,178
30+ day performing delinquency rate ............. 0.60% 0.60% 0.43% 0.39% 0.45% 0.12%