Capital One 2010 Annual Report Download - page 136
Download and view the complete annual report
Please find page 136 of the 2010 Capital One annual report below. You can navigate through the pages in the report by either clicking on the pages listed below, or by using the keyword search tool below to find specific information within the annual report.-
 1
1 -
2
-
3
-
4
-
5
-
6
-
7
-
8
-
9
-
10
-
11
-
12
-
13
-
14
-
15
-
16
-
17
-
18
-
19
-
20
-
21
-
22
-
23
-
24
-
25
-
26
-
27
-
28
-
29
-
30
-
31
-
32
-
33
-
34
-
35
-
36
-
37
-
38
-
39
-
40
-
41
-
42
-
43
-
44
-
45
-
46
-
47
-
48
-
49
-
50
-
51
-
52
-
53
-
54
-
55
-
56
-
57
-
58
-
59
-
60
-
61
-
62
-
63
-
64
-
65
-
66
-
67
-
68
-
69
-
70
-
71
-
72
-
73
-
74
-
75
-
76
-
77
-
78
-
79
-
80
-
81
-
82
-
83
-
84
-
85
-
86
-
87
-
88
-
89
-
90
-
91
-
92
-
93
-
94
-
95
-
96
-
97
-
98
-
99
-
100
-
101
-
102
-
103
-
104
-
105
-
106
-
107
-
108
-
109
-
110
-
111
-
112
-
113
-
114
-
115
-
116
-
117
-
118
-
119
-
120
-
121
-
122
-
123
-
124
-
125
-
 126
126 -
 127
127 -
 128
128 -
 129
129 -
 130
130 -
 131
131 -
 132
132 -
 133
133 -
 134
134 -
 135
135 -
 136
136 -
 137
137 -
 138
138 -
 139
139 -
 140
140 -
 141
141 -
 142
142 -
 143
143 -
 144
144 -
 145
145 -
 146
146 -
147
-
148
-
149
-
150
-
151
-
152
-
153
-
154
-
155
-
156
-
157
-
158
-
159
-
160
-
161
-
162
-
163
-
164
-
165
-
166
-
167
-
168
-
169
-
170
-
171
-
172
-
173
-
174
-
175
-
176
-
177
-
178
-
179
-
180
-
181
-
182
-
183
-
184
-
185
-
186
-
187
-
188
-
189
-
190
-
191
-
192
-
193
-
194
-
195
-
196
-
197
-
198
-
199
-
200
-
201
-
202
-
203
-
204
-
205
-
206
-
207
-
208
-
209
-
210
-
211
-
212
-
213
-
214
-
215
-
216
-
217
-
218
-
219
-
220
-
221
-
222
-
223
-
224
-
225
-
226
 |
 |

CAPITAL ONE FINANCIAL CORPORATION
NOTES TO CONSOLIDATED STATEMENTS
116
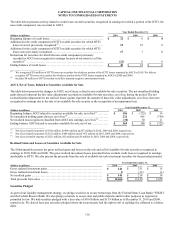
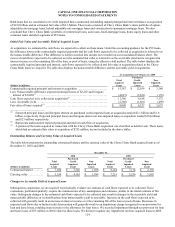
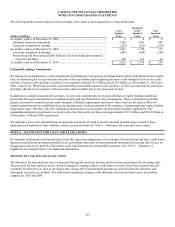
The table below presents activity related to credit losses on debt securities recognized in earnings for which a portion of the OTTI, the
non-credit component, was recorded in AOCI.
Year Ended December 31,
(Dollars in millions) 2010 2009 2008
Beginning balance of credit losses ..........................................
.
$ 32 $ 0 $ 0
Additions for the credit component of OTTI on debt securities for which OTTI
losses were not previously recognized(2) ...................................
.
12 25 0
Additions for the credit component of OTTI on debt securities for which OTTI
losses were previously recognized ........................................
.
17 7 0
Reductions for securities for which the non-credit component previously
recorded in AOCI was recognized in earnings because of our intent to sell the
securities(1) .............................................................
.
(12) 0 0
Ending balance of credit losses .............................................
.
$ 49 $ 32 $ 0
________________________
(1) We recognized $36 million of OTTI losses on securities for which no portion of the OTTI losses remained in AOCI in 2010. We did not
recognize OTTI losses on securities for which no portion of the OTTI losses remained in AOCI in 2009 and 2008.
(2) Includes $4 million of OTTI recorded on held to maturity negative amortization bonds.
AOCI, Net of Taxes, Related to Securities Available for Sale
The table below presents the changes in AOCI, net of taxes, related to our available-for-sale securities. The net unrealized holding
gains (losses) represent the fair value adjustments recorded on available-for-sale securities, net of tax during the period. The net
reclassification adjustment for net realized losses (gains) represent the amount of those fair value adjustments, net of tax, that were
recognized in earnings due to the sale of an available-for-sale security or the recognition of an impairment loss.
Year Ended December 31,
(Dollars in millions) 2010 2009 2008
Beginning balance AOCI related to securities available for sale, net of tax(1) .........
.
$ 186
$ (725) $ 14
N
et unrealized holding gains (losses), net of tax(2) .................................
.
221
861 (750)
N
et realized losses (gains) reclassified from AOCI into earnings, net of tax(3) ........
.
(38 ) 50 11
Ending balance AOCI related to securities available for sale, net of tax..............
.
$ 369
$ 186 $ (725)
________________________
(1) Net of tax benefit (expense) of $102 million, $(404) million and $7 million in 2010, 2009 and 2008, respectively.
(2) Net of tax benefit (expense) of $122 million, $480 million and $(397) million in 2010, 2009 and 2008, respectively.
(3) Net of tax (benefit) expense of $(21) million, $28 million and $6 million in 2010, 2009 and 2008, respectively.
Realized Gains and Losses on Securities Available for Sale
The following table presents the gross realized gains and losses on the sale and call of available-for-sale securities recognized in
earnings in 2010, 2009 and 2008. The gross realized investment losses presented below exclude credit losses recognized in earnings
attributable to OTTI. We also present the proceeds from the sale of available-for-sale investment securities for the periods presented.
Year Ended December 31,
(Dollars in millions) 2010 2009 2008
Gross realized investment gains ............................................. $ 141 $ 231 $ 15
Gross realized investment losses ............................................ 0 (13) (1)
N
et realized gains ......................................................... $ 141 $ 218 $ 14
Total proceeds from sales .................................................. $ 12,466 $ 13,410 $ 2,628
Securities Pledged
As part of our liquidity management strategy, we pledge securities to secure borrowings from the Federal Home Loan Bank (“FHLB”)
and the Federal Reserve Bank. We also pledge securities to secure trust and public deposits and for other purposes as required or
permitted by law. We had securities pledged with a fair value of $10.0 billion and $11.9 billion as of December 31, 2010 and 2009,
respectively. We did not have any securities pledged where the secured party had the right to sell or repledge the collateral as of these
dates.