Capital One 2010 Annual Report Download - page 47
Download and view the complete annual report
Please find page 47 of the 2010 Capital One annual report below. You can navigate through the pages in the report by either clicking on the pages listed below, or by using the keyword search tool below to find specific information within the annual report.-
 1
1 -
2
-
3
-
4
-
5
-
6
-
7
-
8
-
9
-
10
-
11
-
12
-
13
-
14
-
15
-
16
-
17
-
18
-
19
-
20
-
21
-
22
-
23
-
24
-
25
-
26
-
27
-
28
-
29
-
30
-
31
-
32
-
33
-
34
-
35
-
36
-
 37
37 -
 38
38 -
 39
39 -
 40
40 -
 41
41 -
 42
42 -
 43
43 -
 44
44 -
 45
45 -
 46
46 -
 47
47 -
 48
48 -
 49
49 -
 50
50 -
 51
51 -
 52
52 -
 53
53 -
 54
54 -
 55
55 -
 56
56 -
 57
57 -
58
-
59
-
60
-
61
-
62
-
63
-
64
-
65
-
66
-
67
-
68
-
69
-
70
-
71
-
72
-
73
-
74
-
75
-
76
-
77
-
78
-
79
-
80
-
81
-
82
-
83
-
84
-
85
-
86
-
87
-
88
-
89
-
90
-
91
-
92
-
93
-
94
-
95
-
96
-
97
-
98
-
99
-
100
-
101
-
102
-
103
-
104
-
105
-
106
-
107
-
108
-
109
-
110
-
111
-
112
-
113
-
114
-
115
-
116
-
117
-
118
-
119
-
120
-
121
-
122
-
123
-
124
-
125
-
126
-
127
-
128
-
129
-
130
-
131
-
132
-
133
-
134
-
135
-
136
-
137
-
138
-
139
-
140
-
141
-
142
-
143
-
144
-
145
-
146
-
147
-
148
-
149
-
150
-
151
-
152
-
153
-
154
-
155
-
156
-
157
-
158
-
159
-
160
-
161
-
162
-
163
-
164
-
165
-
166
-
167
-
168
-
169
-
170
-
171
-
172
-
173
-
174
-
175
-
176
-
177
-
178
-
179
-
180
-
181
-
182
-
183
-
184
-
185
-
186
-
187
-
188
-
189
-
190
-
191
-
192
-
193
-
194
-
195
-
196
-
197
-
198
-
199
-
200
-
201
-
202
-
203
-
204
-
205
-
206
-
207
-
208
-
209
-
210
-
211
-
212
-
213
-
214
-
215
-
216
-
217
-
218
-
219
-
220
-
221
-
222
-
223
-
224
-
225
-
226
 |
 |
27
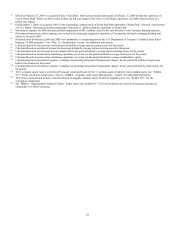
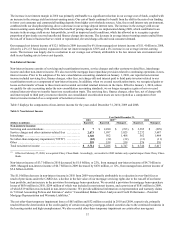
• Charge-off and Delinquency Statistics: Although net charge-off and delinquency rates remain elevated, these rates improved
significantly in 2010. The net charge-off rate decreased to 5.18% in 2010, from 5.87% in 2009, and the 30+ day performing
delinquency rate decreased to 3.52% in 2010, from 4.62% in 2009. Based on strong credit performance trends, such as the
significant decline in the 30+ day performing delinquency rate from 4.62% at the end of 2009, we believe our net-charge offs
resulting from the severe economic downturn peaked in the first quarter of 2010.
• Allowance for Loan and Lease Losses: As a result of the adoption of the new consolidation accounting guidance, we increased
our allowance for loan and lease losses by $4.3 billion to $8.4 billion on January 1, 2010. The initial recording of this amount on
our reported balance sheet as of January 1, 2010 reduced our stockholders’ equity but had no impact on our reported results of
operations. After taking into consideration the $4.3 billion addition to our allowance for loan and lease losses on January 1, 2010,
our allowance for loan and lease losses decreased by $2.8 billion to $5.6 billion as of December 31, 2010. The decrease was
attributable to an overall improvement in credit quality trends, as well as the decrease in loan balances. The allowance as a
percentage of our total reported loans held for investment was 4.47% as of December 31, 2010, compared with 4.55% as of
December 31, 2009.
• Representation and Warranty Reserve: We have established reserves for our mortgage loan repurchase exposure related to the
sale of mortgage loans by our subsidiaries to various parties under contractual provisions that include various representations and
warranties. These reserves reflect inherent losses as of each balance sheet date that we consider to be both probable and
reasonably estimable. We recorded a provision for this exposure of $636 million in 2010, of which $204 million was included in
non-interest income and $432 million was included in discontinued operations. In comparison, we recorded a provision of $181
million in 2009, of which $19 million was included in non-interest income and $162 million was included in discontinued
operations. Because of the significant increase in claim requests from government sponsored entities (“GSEs”) and Active Insured
Securitizations and litigation activity during 2010, we refined our loss estimation process and made certain changes in
assumptions. During second quarter of 2010, we extended the timeframe over which we estimated our repurchase liability for
mortgage loans sold by our subsidiaries to GSEs and those mortgage loans placed into Active Insured Securitizations for the full
life of the mortgage loans, which resulted in a significant increase in the provision for mortgage loan repurchase losses. Of the
$636 million of provision recorded in 2010, approximately $407 million resulted from our ability to extend the timeframe over
which we estimated our repurchase liability. The remaining $229 million related primarily to changing counterparty activity in the
form of updated estimates around active and probable litigation, most of which occurred in the first quarter of 2010. Our
representation and warranty reserves totaled $816 million as of December 31, 2010, compared with $238 million as of December
31, 2009.
• Capital Adequacy: While the consolidation of the loans underlying our securitization trusts on January 1, 2010 reduced our
capital ratios, our financial strength and capacity to absorb risk remained high. Our Tier 1 risk-based capital ratio of 11.63% as of
December 31, 2010 was comfortably above the current minimum regulatory requirement of 4.0%. Our non-GAAP Tier 1
common equity ratio was 8.78% as of December 31, 2010, while our non-GAAP tangible common equity to tangible managed
assets (“TCE ratio”) was 6.86%. See “Exhibit 99.1” for a calculation of our regulatory capital ratios and a reconciliation of our
non-GAAP capital measures.
Business Environment and Significant Recent Developments
The lingering economic and regulatory impacts of 2010 will likely impact the full year income statement in 2011. We expect that 2011
revenue will reflect the full year effects of revenue impacts that began in 2010, including changes to revenue in our Credit Card
business as a result of the CARD Act implementation and the reductions in fee revenues brought on by new regulations. We expect
the slow-paced economic recovery will continue, with the overall unemployment rate expected to remain elevated for an extended
period of time. We also continue to see risks in the housing market, due in part to the large backlog of homes in the foreclosure
process and high rate of delinquent loans, which could be exacerbated if recent disruptions in industry foreclosure practices continue.
We anticipate over the course of coming quarters to see evidence of the path to solid and sustained performance. We believe that
substantially all of the impacts on revenue related to CARD Act regulations were reflected in our fourth quarter revenue margins. We
expect relatively less impact from other aspects of the recently enacted financial legislation. We provide more information on recent
regulatory developments in “Supervision and Regulation” in “Item 1. Business” of this report.
Business Outlook
We discuss below our current expectations regarding our total company performance and the performance of each of our business
segments over the near-term based on market conditions, the regulatory environment and our business strategies as of the time we
filed this Annual Report on Form 10-K. The statements contained in this section are based on our current expectations regarding our
outlook for our financial results and business strategies. Our expectations take into account, and should be read in conjunction with,
our expectations regarding economic trends and analysis of our business as discussed in “Item 1. Business” and “MD&A” of this
report. Certain statements are forward-looking statements within the meaning of the Private Securities Litigation Reform Act of 1995.