Capital One 2010 Annual Report Download - page 157
Download and view the complete annual report
Please find page 157 of the 2010 Capital One annual report below. You can navigate through the pages in the report by either clicking on the pages listed below, or by using the keyword search tool below to find specific information within the annual report.-
 1
1 -
2
-
3
-
4
-
5
-
6
-
7
-
8
-
9
-
10
-
11
-
12
-
13
-
14
-
15
-
16
-
17
-
18
-
19
-
20
-
21
-
22
-
23
-
24
-
25
-
26
-
27
-
28
-
29
-
30
-
31
-
32
-
33
-
34
-
35
-
36
-
37
-
38
-
39
-
40
-
41
-
42
-
43
-
44
-
45
-
46
-
47
-
48
-
49
-
50
-
51
-
52
-
53
-
54
-
55
-
56
-
57
-
58
-
59
-
60
-
61
-
62
-
63
-
64
-
65
-
66
-
67
-
68
-
69
-
70
-
71
-
72
-
73
-
74
-
75
-
76
-
77
-
78
-
79
-
80
-
81
-
82
-
83
-
84
-
85
-
86
-
87
-
88
-
89
-
90
-
91
-
92
-
93
-
94
-
95
-
96
-
97
-
98
-
99
-
100
-
101
-
102
-
103
-
104
-
105
-
106
-
107
-
108
-
109
-
110
-
111
-
112
-
113
-
114
-
115
-
116
-
117
-
118
-
119
-
120
-
121
-
122
-
123
-
124
-
125
-
126
-
127
-
128
-
129
-
130
-
131
-
132
-
133
-
134
-
135
-
136
-
137
-
138
-
139
-
140
-
141
-
142
-
143
-
144
-
145
-
146
-
 147
147 -
 148
148 -
 149
149 -
 150
150 -
 151
151 -
 152
152 -
 153
153 -
 154
154 -
 155
155 -
 156
156 -
 157
157 -
 158
158 -
 159
159 -
 160
160 -
 161
161 -
 162
162 -
 163
163 -
 164
164 -
 165
165 -
 166
166 -
 167
167 -
168
-
169
-
170
-
171
-
172
-
173
-
174
-
175
-
176
-
177
-
178
-
179
-
180
-
181
-
182
-
183
-
184
-
185
-
186
-
187
-
188
-
189
-
190
-
191
-
192
-
193
-
194
-
195
-
196
-
197
-
198
-
199
-
200
-
201
-
202
-
203
-
204
-
205
-
206
-
207
-
208
-
209
-
210
-
211
-
212
-
213
-
214
-
215
-
216
-
217
-
218
-
219
-
220
-
221
-
222
-
223
-
224
-
225
-
226
 |
 |

CAPITAL ONE FINANCIAL CORPORATION
NOTES TO CONSOLIDATED STATEMENTS
137
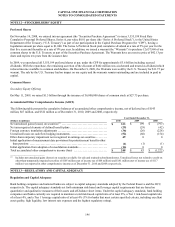
MSR fair value adjustments in 2010 and 2009 included decreases of $28 million and $31 million, respectively, due to run-off and cash
collections, and decreases of $41 million and $6 million, respectively, due to changes in the valuation inputs and assumptions.
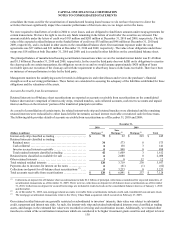
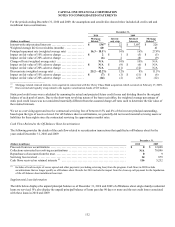
The significant assumptions used in estimating the fair value of the MSRs as of December 31, 2010 and 2009 were as follows:
December 31,
2010 2009
Weighted average prepayment rate (includes default rate) ......................................... 14.25% 17.61%
Weighted average life (in years) ................................................................. 6.07 5.15
Discount rate .................................................................................. 10.23% 11.46%
The decrease in the weighted average prepayment rate and the corresponding increase in weighted average life, were both driven by a
reduction in voluntary attrition due to market conditions.
At December 31, 2010, the sensitivities to immediate 10% and 20% increases in the weighted average prepayment rates would
decrease the fair value of mortgage servicing rights by $6 million and $12 million, respectively.
At December 31, 2010, the sensitivities to immediate 10% and 20% adverse changes in servicing costs would decrease the fair value
of mortgage servicing rights by $11 million and $23 million, respectively.
As of December 31, 2010, our mortgage loan servicing portfolio consisted of mortgage loans with an aggregate unpaid principal
balance of $30.8 billion, of which $20.2 billion was serviced for other investors. As of December 31, 2009, our mortgage loan
servicing portfolio consisted of mortgage loans with an aggregate unpaid principal balance of $43.0 billion, of which $30.3 billion was
serviced for other investors.
NOTE 9—PREMISES, EQUIPMENT & LEASE COMMITMENTS
Premises and Equipment
Premises and equipment are stated at cost less accumulated depreciation and amortization. We capitalize direct costs (including
external costs for purchased software, contractors, consultants and internal staff costs) for internally developed software projects that
have been identified as being in the application development stage. Depreciation and amortization expenses are computed generally by
the straight-line method over the estimated useful lives of the assets. Useful lives for premises and equipment are as follows:
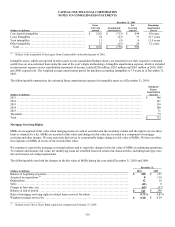
Premises & Equipment Useful Lives
Buildings and improvement ................................................................................ 5-39 years
Furniture and equipment ................................................................................... 3-10 years
Computers and software ................................................................................... 3-7 years
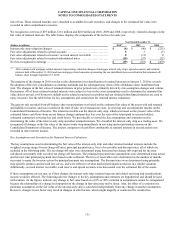
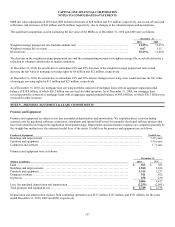
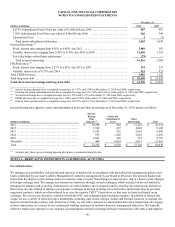
Premises and equipment were as follows:
December 31,
(Dollars in millions) 2010 2009
Land .......................................................................................... $ 562 $ 583
Buildings and improvements .................................................................... 1,948 1,836
Furniture and equipment ........................................................................ 1,315 1,237
Computer software ............................................................................. 921 922
In process ..................................................................................... 258 239
5,004 4,817
Less: Accumulated depreciation and amortization ................................................. (2,255) (2,081)
Total premises and equipment, net ............................................................... $ 2,749 $ 2,736
Depreciation and amortization expense from continuing operations was $327 million, $327 million, and $331 million, for the years
ended December 31, 2010, 2009 and 2008, respectively.