Capital One 2010 Annual Report Download - page 152
Download and view the complete annual report
Please find page 152 of the 2010 Capital One annual report below. You can navigate through the pages in the report by either clicking on the pages listed below, or by using the keyword search tool below to find specific information within the annual report.-
 1
1 -
2
-
3
-
4
-
5
-
6
-
7
-
8
-
9
-
10
-
11
-
12
-
13
-
14
-
15
-
16
-
17
-
18
-
19
-
20
-
21
-
22
-
23
-
24
-
25
-
26
-
27
-
28
-
29
-
30
-
31
-
32
-
33
-
34
-
35
-
36
-
37
-
38
-
39
-
40
-
41
-
42
-
43
-
44
-
45
-
46
-
47
-
48
-
49
-
50
-
51
-
52
-
53
-
54
-
55
-
56
-
57
-
58
-
59
-
60
-
61
-
62
-
63
-
64
-
65
-
66
-
67
-
68
-
69
-
70
-
71
-
72
-
73
-
74
-
75
-
76
-
77
-
78
-
79
-
80
-
81
-
82
-
83
-
84
-
85
-
86
-
87
-
88
-
89
-
90
-
91
-
92
-
93
-
94
-
95
-
96
-
97
-
98
-
99
-
100
-
101
-
102
-
103
-
104
-
105
-
106
-
107
-
108
-
109
-
110
-
111
-
112
-
113
-
114
-
115
-
116
-
117
-
118
-
119
-
120
-
121
-
122
-
123
-
124
-
125
-
126
-
127
-
128
-
129
-
130
-
131
-
132
-
133
-
134
-
135
-
136
-
137
-
138
-
139
-
140
-
141
-
 142
142 -
 143
143 -
 144
144 -
 145
145 -
 146
146 -
 147
147 -
 148
148 -
 149
149 -
 150
150 -
 151
151 -
 152
152 -
 153
153 -
 154
154 -
 155
155 -
 156
156 -
 157
157 -
 158
158 -
 159
159 -
 160
160 -
 161
161 -
 162
162 -
163
-
164
-
165
-
166
-
167
-
168
-
169
-
170
-
171
-
172
-
173
-
174
-
175
-
176
-
177
-
178
-
179
-
180
-
181
-
182
-
183
-
184
-
185
-
186
-
187
-
188
-
189
-
190
-
191
-
192
-
193
-
194
-
195
-
196
-
197
-
198
-
199
-
200
-
201
-
202
-
203
-
204
-
205
-
206
-
207
-
208
-
209
-
210
-
211
-
212
-
213
-
214
-
215
-
216
-
217
-
218
-
219
-
220
-
221
-
222
-
223
-
224
-
225
-
226
 |
 |

CAPITAL ONE FINANCIAL CORPORATION
NOTES TO CONSOLIDATED STATEMENTS
132
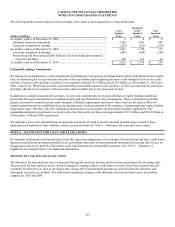
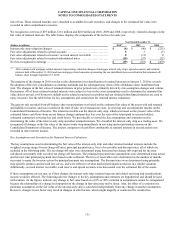
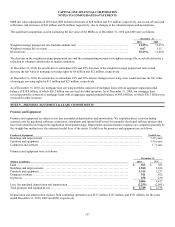
For the periods ending December 31, 2010 and 2009, the assumptions and sensitivities shown below included all credit card and
installment loan securitizations.
December 31,
2010 2009
(Dollars in millions)
Mortgage
Related (1) Interest-
only strip Retained
Interests Mortgage
Related (1)
Interest-only strip retained interests .......................... $ 136(2) $ 22 $ 3,697 $ 226
Weighted average life for receivables (months) ............... 60 7 7 41
Principal repayment rate (weighted average rate) ............. 16.3 – 18.1% 16% 16% 27.8%
Impact on fair value of 10% adverse change .................. $ 2 $ 1 $ (5) $ (5)
Impact on fair value of 20% adverse change .................. (6) 2 (8) (9)
Charge-off rate (weighted average rate) ...................... N/A 10% 10% N/A
Impact on fair value of 10% adverse change .................. $ N/A $ (9) $ (6) $ N/A
Impact on fair value of 20% adverse change .................. N/A (11) (12) N/A
Discount rate (weighted average rate) ........................ 25.2 – 42.2% 12% 8% 11.5%
Impact on fair value of 10% adverse change .................. $ (7) $ (1) $ (11) $ (6)
Impact on fair value of 20% adverse change .................. (14) (2) (23) (12)
________________________
(1) Mortgage related retained interests were acquired in connection with the Chevy Chase Bank acquisition which occurred on February 27, 2009.
(2) Does not include liquidity swap related to the negative amortization bonds of $19 million.
Static pool credit losses were calculated by summing the actual and projected future credit losses and dividing them by the original
balance of each pool of assets. Due to the short-term revolving nature of the loan receivables, the weighted average percentage of
static pool credit losses was not considered materially different from the assumed charge-off rates used to determine the fair value of
the retained interests.
We act as a servicing agent and receive contractual servicing fees of between 0.5% and 4% of the investor principal outstanding,
based upon the type of assets serviced. For off-balance sheet securitizations, we generally did not record material servicing assets or
liabilities for these rights since the contractual servicing fee approximates market rates.
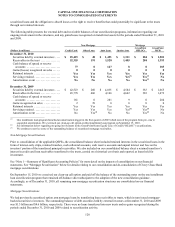
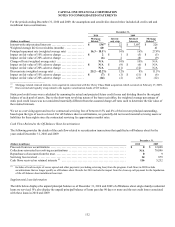
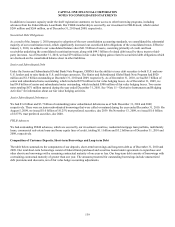
Cash Flows Related to the Off-Balance Sheet Securitizations
The following provides the details of the cash flow related to securitization transactions that qualified as off-balance sheet for the
years ended December 31, 2010 and 2009:
December 31,
(Dollars in millions) 2010 2009
Proceeds from new securitizations ............................................................. $ 0 $ 12,068
Collections reinvested in revolving securitizations .............................................. N/A 70,896
Repurchases of accounts from the trust ......................................................... 0 9
Servicing fees received ....................................................................... 14 879
Cash flows received on retained interests (1) .................................................... 116 5,252
________________________
(1) Includes all cash receipts of excess spread and other payments (excluding servicing fees) from the program. Cash flows in 2009 include
securitizations that no longer qualify as off-balance sheet. Results for 2010 include the impact from the clean-up call payment for the liquidation
of the off-balance sheet installment loan trust.
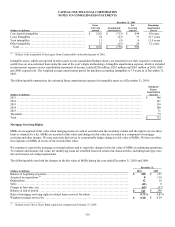
Supplemental Loan Information
The table below displays the unpaid principal balance as of December 31, 2010 and 2009 of off-balance sheet single-family residential
loans we serviced. We also display the unpaid principal balance of loans past due 90 days or more and the net credit losses associated
with these loans in 2010 and 2009.