Capital One 2010 Annual Report Download - page 218
Download and view the complete annual report
Please find page 218 of the 2010 Capital One annual report below. You can navigate through the pages in the report by either clicking on the pages listed below, or by using the keyword search tool below to find specific information within the annual report.-
 1
1 -
2
-
3
-
4
-
5
-
6
-
7
-
8
-
9
-
10
-
11
-
12
-
13
-
14
-
15
-
16
-
17
-
18
-
19
-
20
-
21
-
22
-
23
-
24
-
25
-
26
-
27
-
28
-
29
-
30
-
31
-
32
-
33
-
34
-
35
-
36
-
37
-
38
-
39
-
40
-
41
-
42
-
43
-
44
-
45
-
46
-
47
-
48
-
49
-
50
-
51
-
52
-
53
-
54
-
55
-
56
-
57
-
58
-
59
-
60
-
61
-
62
-
63
-
64
-
65
-
66
-
67
-
68
-
69
-
70
-
71
-
72
-
73
-
74
-
75
-
76
-
77
-
78
-
79
-
80
-
81
-
82
-
83
-
84
-
85
-
86
-
87
-
88
-
89
-
90
-
91
-
92
-
93
-
94
-
95
-
96
-
97
-
98
-
99
-
100
-
101
-
102
-
103
-
104
-
105
-
106
-
107
-
108
-
109
-
110
-
111
-
112
-
113
-
114
-
115
-
116
-
117
-
118
-
119
-
120
-
121
-
122
-
123
-
124
-
125
-
126
-
127
-
128
-
129
-
130
-
131
-
132
-
133
-
134
-
135
-
136
-
137
-
138
-
139
-
140
-
141
-
142
-
143
-
144
-
145
-
146
-
147
-
148
-
149
-
150
-
151
-
152
-
153
-
154
-
155
-
156
-
157
-
158
-
159
-
160
-
161
-
162
-
163
-
164
-
165
-
166
-
167
-
168
-
169
-
170
-
171
-
172
-
173
-
174
-
175
-
176
-
177
-
178
-
179
-
180
-
181
-
182
-
183
-
184
-
185
-
186
-
187
-
188
-
189
-
190
-
191
-
192
-
193
-
194
-
195
-
196
-
197
-
198
-
199
-
200
-
201
-
202
-
203
-
204
-
205
-
206
-
207
-
 208
208 -
 209
209 -
 210
210 -
 211
211 -
 212
212 -
 213
213 -
 214
214 -
 215
215 -
 216
216 -
 217
217 -
 218
218 -
 219
219 -
 220
220 -
 221
221 -
 222
222 -
 223
223 -
 224
224 -
 225
225 -
 226
226
 |
 |

Page 3
CAPITAL ONE FINANCIAL CORPORATION (COF)
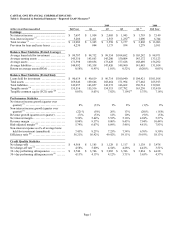
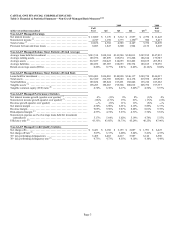
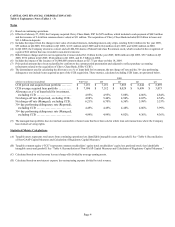
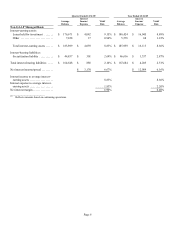
Table 3: Financial & Statistical Summary—Non-GAAP Managed Basis Measures(1)(9)
2009 2008
(dollars in millions)(unaudited)
Full
Year Q4 Q3 Q2 Q1 (2) Full
Year
Non-GAAP Managed Earnings
N
et interest income ............................................. $ 12,089 $ 3,170 $ 3,212 $ 2,957 $ 2,750 $ 11,422
N
on-interest income
(
3
)
........................................... 4,747 1,198 1,373 1,190
(
4
)
986 5,417
Total revenue
(
5
)
................................................ 16,836 4,368 4,585 4,147 3,736 16,839
Provision for loan and lease losses ................................. 8,083 1,847 2,200 1,904 2,132 8,047
Non-GAAP Managed Balance Sheet Statistics (Period Average)
Average loans held for investment ................................. $143,514 $138,184 $143,540 $148,013 $147,182 $147,812
Average earning assets ........................................... 185,976 183,899 185,874 191,208 186,614 179,387
Average assets ................................................. 212,657 210,425 214,655 218,402 210,169 203,554
Average liabilities .............................................. 186,052 183,907 188,653 190,734 183,165 178,276
Return on average assets (ROA) ................................... 0.46% 0.77% 0.81% 0.42% (0.16)% 0.04%
Non-GAAP Managed Balance Sheet Statistics (Period End)
Loans held for investment ........................................ $136,803 $136,803 $140,990 $146,117 $149,730 $146,937
Total assets .................................................... 212,389 212,389 209,683 214,178 219,958 209,875
Total liabilities ................................................. 185,824 185,824 183,491 188,846 193,210 183,262
Tangible assets
(
A
)
.............................................. 198,283 198,283 195,566 200,012 205,756 197,337
Tangible common equity (TCE) ratio
(
B
)
............................ 6.30% 6.30% 6.17% 5.60%
(
6
)
4.56% 5.57%
Non-GAAP Managed Performance Statistics
N
et interest income growth (quarter over quarter)
(
7
)
.................. 6% (1)% 9% 8% (1)% 4%
N
on-interest income growth (quarter over quarter)
(
7
)
.................. (12)% (13)% 15% 21% (17)% (6)%
Revenue growth (quarter over quarter) ............................. ―% (5)% 11% 11% (5)% ―%
N
et interest margin .............................................. 6.50% 6.90% 6.91% 6.19% 5.89% 6.37%
Revenue margin ................................................ 9.05% 9.50% 9.87% 8.68% 8.01% 9.39%
Risk-adjusted margin
(
C
)
......................................... 4.53% 4.74% 5.23% 4.31% 3.74% 5.81%
N
on-interest expense as a% of average loans held for investment
(annualized) ................................................. 5.17% 5.64% 5.02% 5.19% 4.74% 5.55%
Efficiency ratio
(
D
)
.............................................. 43.35% 43.85% 38.73% 45.29% 46.25% 47.96%
Non-GAAP Managed Credit Quality Statistics
N
et charge-offs ................................................. $ 8,421 $ 2,188 $ 2,155 $ 2,087 $ 1,991 $ 6,425
N
et charge-off rate
(
8
)
............................................ 5.87% 6.33% 6.00% 5.64% 5.41% 4.35%
30+ day performing delinquencies ................................. 6,465 6,465 6,417 5,987 6,146 6,596
30+ day performing delinquency rate
(
8
)
............................. 4.73% 4.73% 4.55% 4.10% 4.10% 4.49%