Capital One 2010 Annual Report Download - page 156
Download and view the complete annual report
Please find page 156 of the 2010 Capital One annual report below. You can navigate through the pages in the report by either clicking on the pages listed below, or by using the keyword search tool below to find specific information within the annual report.
CAPITAL ONE FINANCIAL CORPORATION
NOTES TO CONSOLIDATED STATEMENTS
136
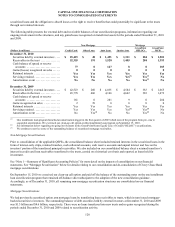
December 31, 2009
(Dollars in millions)
Gross
Carrying
Amount Accumulated
Amortization
Net
Carrying
Amount
Remaining
Amortization
Period
Core deposit intangibles ....................................
.
$ 1,562 $ (713) $ 849 8.0 years
Lease intangibles ..........................................
.
54 (23) 31 22.7 years
Trust intangibles ...........................................
.
11 (5) 6 13.9 years
Other intangibles ...........................................
.
35 (15) 20 3.2 years
Total ....................................................
.
$ 1,662 $ (756) $ 906
________________________
(1) Relates to the acquisition of the legacy Sony Card portfolio in the third quarter of 2010.
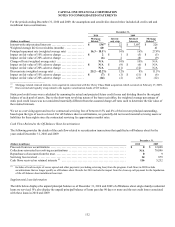
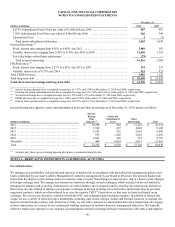
Intangible assets, which are reported in other assets on our consolidated balance sheets, are amortized over their respective estimated
useful lives on an accelerated basis using the sum of the year’s digits methodology. Intangible amortization expense, which is included
in non-interest expense on our consolidated statements of income, totaled $220 million, $235 million and $201 million in 2010, 2009
and 2008, respectively. The weighted average amortization period for purchase accounting intangibles is 7.4 years as of December 31,
2010.
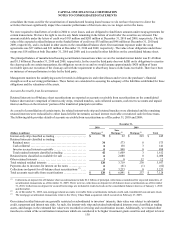
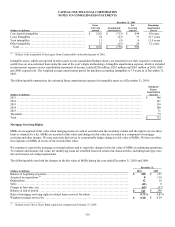
The following table summarizes the estimated future amortization expense for intangible assets as of December 31, 2010:
(Dollars in millions)
Estimated
Future
Amortization
Amounts
2011 ....................................................................................................
.
$ 196
2012 ....................................................................................................
.
161
2013 ....................................................................................................
.
130
2014 ....................................................................................................
.
100
2015 ....................................................................................................
.
71
Thereafter ...............................................................................................
.
75
Total ....................................................................................................
.
$ 733
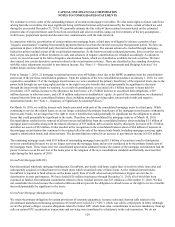
Mortgage Servicing Rights
MSRs are recognized at fair value when mortgage loans are sold or securitized in the secondary market and the right to service these
loans is retained for a fee. MSRs are recorded at fair value and changes in fair value are recorded as a component of mortgage
servicing and other income. We may enter into derivatives to economically hedge changes in fair value of MSRs. We have no other
loss exposure on MSRs in excess of the recorded fair value.
We continue to operate the mortgage servicing business and to report the changes in the fair value of MSRs in continuing operations.
To evaluate and measure fair value, the underlying loans are stratified based on certain risk characteristics, including loan type, note
rate and investor servicing requirements.
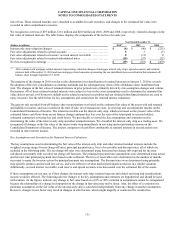
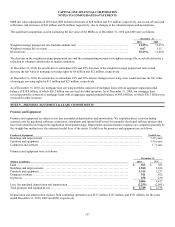
The following table sets forth the changes in the fair value of MSRs during the year ended December 31, 2010 and 2009:
December 31,
(Dollars in millions) 2010 2009
Balance at beginning of period ................................................................... $ 240 $ 151
Acquired in acquisitions (1) ...................................................................... 0 110
Originations ................................................................................... 12 16
Sales .......................................................................................... (42) 0
Change in fair value, net ........................................................................ (69) (37)
Balance at end of period ........................................................................ $ 141 $ 240
Ratio of mortgage servicing rights to related loans serviced for others .............................. 0.71% 0.81%
Weighted average service fee ................................................................... $ 0.28 $ 0.29
________________________
(1) Related to the Chevy Chase Bank acquisition completed on February 27, 2009.


