Capital One 2010 Annual Report Download - page 221
Download and view the complete annual report
Please find page 221 of the 2010 Capital One annual report below. You can navigate through the pages in the report by either clicking on the pages listed below, or by using the keyword search tool below to find specific information within the annual report.-
 1
1 -
2
-
3
-
4
-
5
-
6
-
7
-
8
-
9
-
10
-
11
-
12
-
13
-
14
-
15
-
16
-
17
-
18
-
19
-
20
-
21
-
22
-
23
-
24
-
25
-
26
-
27
-
28
-
29
-
30
-
31
-
32
-
33
-
34
-
35
-
36
-
37
-
38
-
39
-
40
-
41
-
42
-
43
-
44
-
45
-
46
-
47
-
48
-
49
-
50
-
51
-
52
-
53
-
54
-
55
-
56
-
57
-
58
-
59
-
60
-
61
-
62
-
63
-
64
-
65
-
66
-
67
-
68
-
69
-
70
-
71
-
72
-
73
-
74
-
75
-
76
-
77
-
78
-
79
-
80
-
81
-
82
-
83
-
84
-
85
-
86
-
87
-
88
-
89
-
90
-
91
-
92
-
93
-
94
-
95
-
96
-
97
-
98
-
99
-
100
-
101
-
102
-
103
-
104
-
105
-
106
-
107
-
108
-
109
-
110
-
111
-
112
-
113
-
114
-
115
-
116
-
117
-
118
-
119
-
120
-
121
-
122
-
123
-
124
-
125
-
126
-
127
-
128
-
129
-
130
-
131
-
132
-
133
-
134
-
135
-
136
-
137
-
138
-
139
-
140
-
141
-
142
-
143
-
144
-
145
-
146
-
147
-
148
-
149
-
150
-
151
-
152
-
153
-
154
-
155
-
156
-
157
-
158
-
159
-
160
-
161
-
162
-
163
-
164
-
165
-
166
-
167
-
168
-
169
-
170
-
171
-
172
-
173
-
174
-
175
-
176
-
177
-
178
-
179
-
180
-
181
-
182
-
183
-
184
-
185
-
186
-
187
-
188
-
189
-
190
-
191
-
192
-
193
-
194
-
195
-
196
-
197
-
198
-
199
-
200
-
201
-
202
-
203
-
204
-
205
-
206
-
207
-
208
-
209
-
210
-
 211
211 -
 212
212 -
 213
213 -
 214
214 -
 215
215 -
 216
216 -
 217
217 -
 218
218 -
 219
219 -
 220
220 -
 221
221 -
 222
222 -
 223
223 -
 224
224 -
 225
225 -
 226
226
 |
 |

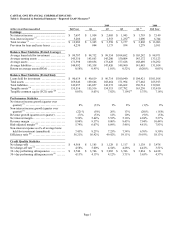
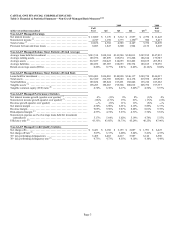
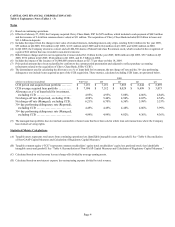
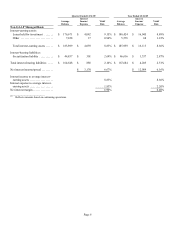
Page 6
Quarter Ended 12/31/09 Year Ended 12/31/09
Average
Balance
Interest
Income/
Expense
Yield/
Rate
Average
Balance
Interest
Income/
Expense
Yield/
Rate
Non-GAAP Managed Basis
Interest-earning assets:
Loans held for investment ....... $ 176,671 $ 4,042 9.15% $ 180,424 $ 16,045 8.89%
Other .......................... 7,228 17 0.94% 5,535 68 1.23%
Total interest-earning assets ...... $ 183,899 $ 4,059 8.83% $ 185,959 $ 16,113 8.66%
Interest-bearing liabilities:
Securitization liability ........... $ 44,837 $ 301 2.69% $ 46,616 $ 1,337 2.87%
Total interest-bearing liabilities .... $ 164,648 $ 888 2.16% $ 167,684 $ 4,205 2.51%
N
et interest income/spread ......... $ 3,170 6.67% $ 12,089 6.16%
Interest income to average interest-
earning assets ................... 8.83% 8.66%
Interest expense to average interest-
earning assets ................... 1.93% 2.26%
N
et interest margin ................ 6.90% 6.40%
________________________
(1) Reflects amounts based on continuing operations.