Capital One 2010 Annual Report Download - page 163
Download and view the complete annual report
Please find page 163 of the 2010 Capital One annual report below. You can navigate through the pages in the report by either clicking on the pages listed below, or by using the keyword search tool below to find specific information within the annual report.-
 1
1 -
2
-
3
-
4
-
5
-
6
-
7
-
8
-
9
-
10
-
11
-
12
-
13
-
14
-
15
-
16
-
17
-
18
-
19
-
20
-
21
-
22
-
23
-
24
-
25
-
26
-
27
-
28
-
29
-
30
-
31
-
32
-
33
-
34
-
35
-
36
-
37
-
38
-
39
-
40
-
41
-
42
-
43
-
44
-
45
-
46
-
47
-
48
-
49
-
50
-
51
-
52
-
53
-
54
-
55
-
56
-
57
-
58
-
59
-
60
-
61
-
62
-
63
-
64
-
65
-
66
-
67
-
68
-
69
-
70
-
71
-
72
-
73
-
74
-
75
-
76
-
77
-
78
-
79
-
80
-
81
-
82
-
83
-
84
-
85
-
86
-
87
-
88
-
89
-
90
-
91
-
92
-
93
-
94
-
95
-
96
-
97
-
98
-
99
-
100
-
101
-
102
-
103
-
104
-
105
-
106
-
107
-
108
-
109
-
110
-
111
-
112
-
113
-
114
-
115
-
116
-
117
-
118
-
119
-
120
-
121
-
122
-
123
-
124
-
125
-
126
-
127
-
128
-
129
-
130
-
131
-
132
-
133
-
134
-
135
-
136
-
137
-
138
-
139
-
140
-
141
-
142
-
143
-
144
-
145
-
146
-
147
-
148
-
149
-
150
-
151
-
152
-
 153
153 -
 154
154 -
 155
155 -
 156
156 -
 157
157 -
 158
158 -
 159
159 -
 160
160 -
 161
161 -
 162
162 -
 163
163 -
 164
164 -
 165
165 -
 166
166 -
 167
167 -
 168
168 -
 169
169 -
 170
170 -
 171
171 -
 172
172 -
 173
173 -
174
-
175
-
176
-
177
-
178
-
179
-
180
-
181
-
182
-
183
-
184
-
185
-
186
-
187
-
188
-
189
-
190
-
191
-
192
-
193
-
194
-
195
-
196
-
197
-
198
-
199
-
200
-
201
-
202
-
203
-
204
-
205
-
206
-
207
-
208
-
209
-
210
-
211
-
212
-
213
-
214
-
215
-
216
-
217
-
218
-
219
-
220
-
221
-
222
-
223
-
224
-
225
-
226
 |
 |

CAPITAL ONE FINANCIAL CORPORATION
NOTES TO CONSOLIDATED STATEMENTS
143
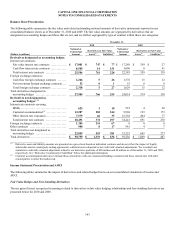
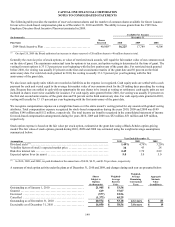
Balance Sheet Presentation
The following table summarizes the fair value and related outstanding notional amounts of derivative instruments reported in our
consolidated balance sheets as of December 31, 2010 and 2009. The fair value amounts are segregated by derivatives that are
designated as accounting hedges and those that are not, and are further segregated by type of contract within those two categories.
December 31,
2010 2009
(Dollars in millions)
Notional or
Contractual
Amount
Derivatives at Fair Value Notional or
Contractual
Amount
Derivatives at Fair Value
Assets(1) Liabilities(1) Assets(1) Liabilities(1)
Derivatives designated as accounting hedges:
Interest rate contracts:
Fair value interest rate contracts ............. $ 17,001 $ 747 $ 77 $ 17,289 $ 359 $ 27
Cash flow interest rate contracts ............. 8,585 14 151 5,096 0 91
Total interest rate contracts ................. 25,586 761 228 22,385 359 118
Foreign exchange contracts:
Cash flow foreign exchange contracts ....... 2,266 5 26 1,576 15 12
Net investment foreign exchange contracts .... 52 0 1 53 0 0
Total foreign exchange contracts ............ 2,318 5 27 1,629 15 12
Total derivatives designated as
accounting hedges ......................... 27,904 766 255 24,014 374 130
Derivatives not designated as
accounting hedges: (1)
Interest rate contracts covering:
MSRs ..................................... 625 3 18 935 4 20
Customer accommodation(2) ................ 12,287 282 244 9,968 193 173
Other interest rate exposures ................. 7,579 46 35 23,338 494 77
Total interest rate contracts ................. 20,491 331 297 34,241 691 270
Foreign exchange contracts ................... 1,384 214 67 0 0 0
Other contracts .............................. 980 8 17 981 4 7
Total derivatives not designated as
accounting hedges ......................... 22,855 553 381 35,222 695 277
Total derivatives ............................. $ 50,759 $ 1,319 $ 636 $ 59,236 $ 1,069 $ 407
________________________
(1) Derivative asset and liability amounts are presented on a gross basis based on individual contracts and do not reflect the impact of legally
enforceable master counterparty netting agreements, collateral received/posted or net credit risk valuation adjustments. We recorded a net
cumulative credit risk valuation adjustment related to our derivative positions of $20 million and $4 million as of December 31, 2010 and 2009,
respectively. See “Derivative Counterparty Credit Risk” below for additional information.
(2) Customer accommodation derivatives include those entered into with our commercial banking customers and those entered into with other
counterparties to offset the market risk.
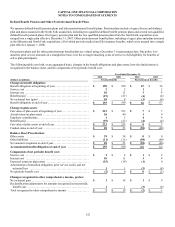
Income Statement Presentation and AOCI
The following tables summarize the impact of derivatives and related hedged items on our consolidated statements of income and
AOCI.
Fair Value Hedges and Free-Standing Derivatives
The net gains (losses) recognized in earnings related to derivatives in fair value hedging relationships and free-standing derivatives are
presented below for 2010 and 2009.