Capital One 2010 Annual Report Download - page 188
Download and view the complete annual report
Please find page 188 of the 2010 Capital One annual report below. You can navigate through the pages in the report by either clicking on the pages listed below, or by using the keyword search tool below to find specific information within the annual report.-
 1
1 -
2
-
3
-
4
-
5
-
6
-
7
-
8
-
9
-
10
-
11
-
12
-
13
-
14
-
15
-
16
-
17
-
18
-
19
-
20
-
21
-
22
-
23
-
24
-
25
-
26
-
27
-
28
-
29
-
30
-
31
-
32
-
33
-
34
-
35
-
36
-
37
-
38
-
39
-
40
-
41
-
42
-
43
-
44
-
45
-
46
-
47
-
48
-
49
-
50
-
51
-
52
-
53
-
54
-
55
-
56
-
57
-
58
-
59
-
60
-
61
-
62
-
63
-
64
-
65
-
66
-
67
-
68
-
69
-
70
-
71
-
72
-
73
-
74
-
75
-
76
-
77
-
78
-
79
-
80
-
81
-
82
-
83
-
84
-
85
-
86
-
87
-
88
-
89
-
90
-
91
-
92
-
93
-
94
-
95
-
96
-
97
-
98
-
99
-
100
-
101
-
102
-
103
-
104
-
105
-
106
-
107
-
108
-
109
-
110
-
111
-
112
-
113
-
114
-
115
-
116
-
117
-
118
-
119
-
120
-
121
-
122
-
123
-
124
-
125
-
126
-
127
-
128
-
129
-
130
-
131
-
132
-
133
-
134
-
135
-
136
-
137
-
138
-
139
-
140
-
141
-
142
-
143
-
144
-
145
-
146
-
147
-
148
-
149
-
150
-
151
-
152
-
153
-
154
-
155
-
156
-
157
-
158
-
159
-
160
-
161
-
162
-
163
-
164
-
165
-
166
-
167
-
168
-
169
-
170
-
171
-
172
-
173
-
174
-
175
-
176
-
177
-
 178
178 -
 179
179 -
 180
180 -
 181
181 -
 182
182 -
 183
183 -
 184
184 -
 185
185 -
 186
186 -
 187
187 -
 188
188 -
 189
189 -
 190
190 -
 191
191 -
 192
192 -
 193
193 -
 194
194 -
 195
195 -
 196
196 -
 197
197 -
 198
198 -
199
-
200
-
201
-
202
-
203
-
204
-
205
-
206
-
207
-
208
-
209
-
210
-
211
-
212
-
213
-
214
-
215
-
216
-
217
-
218
-
219
-
220
-
221
-
222
-
223
-
224
-
225
-
226
 |
 |
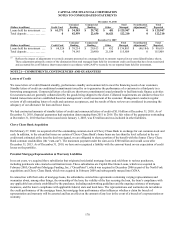
CAPITAL ONE FINANCIAL CORPORATION
NOTES TO CONSOLIDATED STATEMENTS
168
assumptions management believes are appropriate to reflect the results of each business segment. Due to the integrated nature of our
business segments, estimates and judgments have been made in allocating certain revenue and expense items. Transactions between
segments are based on specific criteria or approximate third-party rates. We regularly assess the assumptions, methodologies and
reporting classifications used for segment reporting, which may result in the implementation of refinements or changes in future
periods.
Following is a description of the principles and methodologies used in preparing our business segment results.
• Net interest income: Interest income from loans held for investment and interest expense from deposits and other interest-bearing
liabilities are reflected within each applicable business segment. Because funding and asset/liability management are managed
centrally by our Corporate Treasury Group, net interest income for our business segments also includes the results of a funds
transfer pricing process that is intended to allocate a cost of funds used or credit for funds provided to all business segment assets
and liabilities, respectively, using a matched funding concept. Also, taxable-equivalent benefit of tax-exempt products is
allocated to each business unit with a corresponding increase in income tax expense.
• Non-interest income: Non-interest fees and other revenue associated with loans or customers managed by each business segment
and other direct revenues are accounted for within each business segment.
• Provision for loan and lease losses: The provisions for loan and lease losses are directly attributable to the business segment in
which the loans are managed.
• Non-interest expense: Non-interest expenses directly managed and incurred by a business segment are accounted for within each
business segment. We allocate certain non-interest expenses indirectly incurred by business segments, such as corporate support
functions, to each business segment based on various factors, including the actual cost of the services from the service providers,
the utilization of the services, the number of employees or other relevant factors.
• Goodwill and other intangible assets: Goodwill and other intangible assets are assigned to business segments based on the
relative fair value of each segment. Intangible amortization is included in the results of the applicable segment.
• Income taxes: Income taxes are assessed for each business segment based on a standard tax rate with the residual tax expense or
benefit to arrive at the consolidated effective tax rate included in the Other category.
• Loans held for investment: Loans are reported within each business segment based on product or customer type.
• Deposits: Deposits are reported within each business segment based on product or customer type.
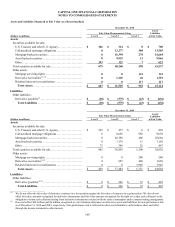
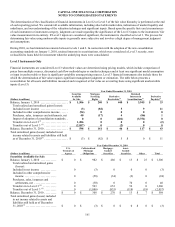
Segment Results and Reconciliation
The following tables provide a summary of our business segment results for the years ended December 31, 2010, 2009 and 2008 and
selected balance sheet data as of December 31, 2010 and 2009. Total consolidated assets are not allocated among our business
segments in the information that is reviewed by our chief operating decision maker. The total of our business segment results and
“Other” category, or “Total Managed,” differs from our total consolidated reported results. The impact of these differences is reflected
in the “Securitization Adjustments” category. The securitization adjustments remove the impact of presenting off-balance sheet
securitized loans in our business segment results in the same manner as on-balance sheet loans to reconcile to our total consolidated
reported results.
We may periodically change our business segments or reclassify business segment results based on modifications to our management
reporting methodologies and changes in organizational alignment.