Capital One 2010 Annual Report Download - page 71
Download and view the complete annual report
Please find page 71 of the 2010 Capital One annual report below. You can navigate through the pages in the report by either clicking on the pages listed below, or by using the keyword search tool below to find specific information within the annual report.-
 1
1 -
2
-
3
-
4
-
5
-
6
-
7
-
8
-
9
-
10
-
11
-
12
-
13
-
14
-
15
-
16
-
17
-
18
-
19
-
20
-
21
-
22
-
23
-
24
-
25
-
26
-
27
-
28
-
29
-
30
-
31
-
32
-
33
-
34
-
35
-
36
-
37
-
38
-
39
-
40
-
41
-
42
-
43
-
44
-
45
-
46
-
47
-
48
-
49
-
50
-
51
-
52
-
53
-
54
-
55
-
56
-
57
-
58
-
59
-
60
-
 61
61 -
 62
62 -
 63
63 -
 64
64 -
 65
65 -
 66
66 -
 67
67 -
 68
68 -
 69
69 -
 70
70 -
 71
71 -
 72
72 -
 73
73 -
 74
74 -
 75
75 -
 76
76 -
 77
77 -
 78
78 -
 79
79 -
 80
80 -
 81
81 -
82
-
83
-
84
-
85
-
86
-
87
-
88
-
89
-
90
-
91
-
92
-
93
-
94
-
95
-
96
-
97
-
98
-
99
-
100
-
101
-
102
-
103
-
104
-
105
-
106
-
107
-
108
-
109
-
110
-
111
-
112
-
113
-
114
-
115
-
116
-
117
-
118
-
119
-
120
-
121
-
122
-
123
-
124
-
125
-
126
-
127
-
128
-
129
-
130
-
131
-
132
-
133
-
134
-
135
-
136
-
137
-
138
-
139
-
140
-
141
-
142
-
143
-
144
-
145
-
146
-
147
-
148
-
149
-
150
-
151
-
152
-
153
-
154
-
155
-
156
-
157
-
158
-
159
-
160
-
161
-
162
-
163
-
164
-
165
-
166
-
167
-
168
-
169
-
170
-
171
-
172
-
173
-
174
-
175
-
176
-
177
-
178
-
179
-
180
-
181
-
182
-
183
-
184
-
185
-
186
-
187
-
188
-
189
-
190
-
191
-
192
-
193
-
194
-
195
-
196
-
197
-
198
-
199
-
200
-
201
-
202
-
203
-
204
-
205
-
206
-
207
-
208
-
209
-
210
-
211
-
212
-
213
-
214
-
215
-
216
-
217
-
218
-
219
-
220
-
221
-
222
-
223
-
224
-
225
-
226
 |
 |

51
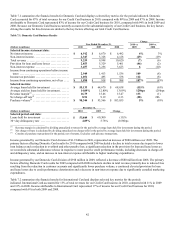
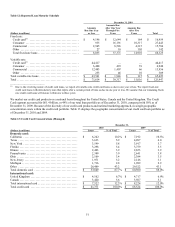
Table 12: Reported Loan Maturity Schedule
December 31, 2010
(Dollars in millions)
Amounts
Due One Year
or Less
Amounts Due
After One Year
Through Five
Years
Amounts Due
After Five
Years Total
Fixed rate:
Credit card(1) .......................................
.
$ 4,146 $ 12,644 $ 164 $ 16,954
Consumer ..........................................
.
935 16,191 10,317 27,443
Commercial ........................................
.
2,945 8,526 4,315 15,786
Other ..............................................
.
27 10 105 142
Total fixed-rate loans ................................
.
8,053 37,371 14,901 60,325
Variable rate:
Credit card(1) .......................................
.
44,417
—
—
44,417
Consumer ..........................................
.
6,408 493 39 6,940
Commercial ........................................
.
12,483 1,407 66 13,956
Other ..............................................
.
253 46 10 309
Total variable-rate loans ...............................
.
$ 63,561 $ 1,946 $ 115 $ 65,622
Total .................................................
.
$ 71,614 $ 39,317 $ 15,016 $ 125,947
________________________
(1) Due to the revolving nature of credit card loans, we report all variable-rate credit card loans as due in one year or less. We report fixed-rate
credit card loans with introductory rates that expire after a certain period of time as due in one year or less. We assume that our remaining fixed-
rate credit card loans will mature within one to three years
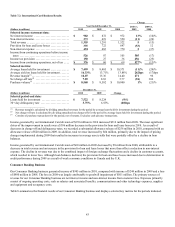
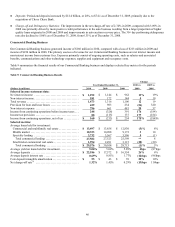
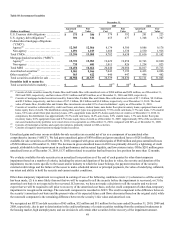
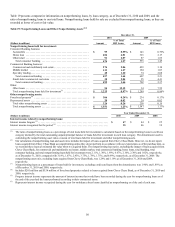
We market our credit card products on a national basis throughout the United States, Canada and the United Kingdom. The Credit
Card segment accounted for $61.4 billion, or 49% of our total loan portfolio as of December 31, 2010, compared with 50% as of
December 31, 2009. Because of the diversity of our credit card products and national marketing approach, no single geographic
concentration exists within the credit card portfolio. Table 13 displays the geographic concentration of our credit card loan portfolio as
of December 31, 2010 and 2009.
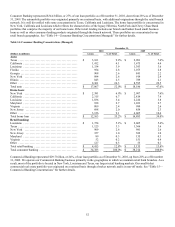
Table 13: Credit Card Concentrations (Managed)
December 31,
2010 2009
(Dollars in millions) Loans % of Total Loans % of Total
Domestic card:
California ............................................ $ 6,242 10.2% $ 7,192 10.5%
Texas ................................................ 3,633 5.9 4,097 6.0
N
ew York ............................................ 3,599 5.8 3,917 5.7
Florida ............................................... 3,298 5.4 3,759 5.5
Illinois ............................................... 2,403 3.9 2,653 3.9
Pennsylvania ......................................... 2,389 3.9 2,641 3.8
Ohio ................................................. 2,109 3.4 2,384 3.5
N
ew Jersey ........................................... 1,971 3.2 2,146 3.1
Michigan ............................................. 1,716 2.8 1,989 2.9
Other ................................................ 26,489 43.2 29,522 43.1
Total domestic card ................................... $ 53,849 87.7% $ 60,300 88.0%
International card:
United Kingdom ...................................... $ 4,102 6.7% $ 4,717 6.9%
Canada ............................................... 3,420 5.6 3,507 5.1
Total international card ................................ $ 7,522 12.3% $ 8,224 12.0%
Total credit card ...................................... $ 61,371 100.0% $ 68,524 100.0%