Capital One 2010 Annual Report Download - page 43
Download and view the complete annual report
Please find page 43 of the 2010 Capital One annual report below. You can navigate through the pages in the report by either clicking on the pages listed below, or by using the keyword search tool below to find specific information within the annual report.-
 1
1 -
2
-
3
-
4
-
5
-
6
-
7
-
8
-
9
-
10
-
11
-
12
-
13
-
14
-
15
-
16
-
17
-
18
-
19
-
20
-
21
-
22
-
23
-
24
-
25
-
26
-
27
-
28
-
29
-
30
-
31
-
32
-
 33
33 -
 34
34 -
 35
35 -
 36
36 -
 37
37 -
 38
38 -
 39
39 -
 40
40 -
 41
41 -
 42
42 -
 43
43 -
 44
44 -
 45
45 -
 46
46 -
 47
47 -
 48
48 -
 49
49 -
 50
50 -
 51
51 -
 52
52 -
 53
53 -
54
-
55
-
56
-
57
-
58
-
59
-
60
-
61
-
62
-
63
-
64
-
65
-
66
-
67
-
68
-
69
-
70
-
71
-
72
-
73
-
74
-
75
-
76
-
77
-
78
-
79
-
80
-
81
-
82
-
83
-
84
-
85
-
86
-
87
-
88
-
89
-
90
-
91
-
92
-
93
-
94
-
95
-
96
-
97
-
98
-
99
-
100
-
101
-
102
-
103
-
104
-
105
-
106
-
107
-
108
-
109
-
110
-
111
-
112
-
113
-
114
-
115
-
116
-
117
-
118
-
119
-
120
-
121
-
122
-
123
-
124
-
125
-
126
-
127
-
128
-
129
-
130
-
131
-
132
-
133
-
134
-
135
-
136
-
137
-
138
-
139
-
140
-
141
-
142
-
143
-
144
-
145
-
146
-
147
-
148
-
149
-
150
-
151
-
152
-
153
-
154
-
155
-
156
-
157
-
158
-
159
-
160
-
161
-
162
-
163
-
164
-
165
-
166
-
167
-
168
-
169
-
170
-
171
-
172
-
173
-
174
-
175
-
176
-
177
-
178
-
179
-
180
-
181
-
182
-
183
-
184
-
185
-
186
-
187
-
188
-
189
-
190
-
191
-
192
-
193
-
194
-
195
-
196
-
197
-
198
-
199
-
200
-
201
-
202
-
203
-
204
-
205
-
206
-
207
-
208
-
209
-
210
-
211
-
212
-
213
-
214
-
215
-
216
-
217
-
218
-
219
-
220
-
221
-
222
-
223
-
224
-
225
-
226
 |
 |

23
Item 7. Management’s Discussion and Analysis of Financial Condition and Results of Operations
This Management’s Discussion and Analysis of Financial Condition and Results of Operations (“MD&A”) should be read in
conjunction with our audited consolidated financial statements as of December 31, 2010 and related notes. This discussion contains
forward-looking statements that are based upon management’s current expectations and are subject to significant uncertainties and
changes in circumstances. Please review “Item 1. Business—Forward-Looking Statements” for more information on the forward-
looking statements in this report. Our actual results may differ materially from those included in these forward-looking statements due
to a variety of factors including, but not limited to, those described in this report in “Item 1A. Risk Factors.”
INTRODUCTION
We are a diversified financial services company with banking and non-banking subsidiaries that market a variety of financial products
and services. We continue to deliver on our strategy of combining the power of national scale lending and local scale banking.
Our revenues are primarily driven by lending to consumers and commercial customers and by deposit-taking activities, which generate
net interest income, and by activities that generate non-interest income, including the sale and servicing of loans and providing fee-
based services to customers. Customer usage and payment patterns, credit quality, levels of marketing expense and operating
efficiency all affect our profitability. Our expenses primarily consist of the cost of funding our assets, our provision for loan and lease
losses, operating expenses (including associate salaries and benefits, infrastructure maintenance and enhancements, and branch
operations and expansion costs), marketing expenses and income taxes. We had $125.9 billion in total loans outstanding and $122.2
billion in deposits as of December 31, 2010, compared with $136.8 billion in total managed loans outstanding and $115.8 billion in
deposits as of December 31, 2009.
We evaluate our financial performance and report our results through three operating segments: Credit Card, Consumer Banking and
Commercial Banking.
• Credit Card: Consists of our domestic consumer and small business card lending, national small business lending, national closed
end installment lending and the international card lending businesses in Canada and the United Kingdom.
• Consumer Banking: Consists of our branch-based lending and deposit gathering activities for consumer and small businesses,
national deposit gathering, national automobile lending and consumer home loan lending and servicing activities.
• Commercial Banking: Consists of our lending, deposit gathering and treasury management services to commercial real estate and
middle market customers.
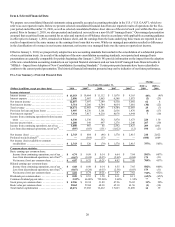
Table 1 summarizes our business segment results for 2010, 2009 and 2008. We report our business segment results based on income
from continuing operations, net of tax.
Table 1: Business Segment Results(1)
Year Ended December 31,
2010 2009 2008
Total
Revenue (2)
Net Income
(Loss)(3)
Total
Revenue (2)
Net Income
(Loss)(3)
Total
Revenue (2)
Net Income
(Loss)(3)
(Dollars in millions) Amount
% of
Total Amount
% of
Total Amount
% of
Total Amount
% of
Total Amount
% of
Total Amount
% of
Total
Credit Card ........ $ 10,614 66% $ 2,274 75%$ 11,289 67% $ 978 99% $ 12,142 72% $ 1,067 1,255%
Consumer
Banking ......... 4,597 28 905 30 3,986 24 244 25 3,717 22 (980) (1,153)
Commercial
Banking ......... 1,473 9 160 5 1,316 8 (213) (22) 1,106 7 254 299
Other
(
4
)
............ (507) (3) (289 ) (10) 245 1 (22) (2) (126) (1) (256) (301)
Total from continuing
operations ....... $ 16,177 100% $ 3,050 100%$ 16,836 100% $ 987 100% $ 16,839 100% $ 85 100%
________________________
(1) See “Note 20—Business Segments” for a reconciliation of our total business segment results to our consolidated U.S. GAAP results.
(2) Total revenue consists of net interest income and non-interest income. Total revenue displayed for 2009 and 2008 is based on our non-GAAP
managed basis results. For more information on this measure and a reconciliation to the comparable U.S. GAAP measure, see “Exhibit 99.1.”
(3) Includes the residual impact of the allocation of our centralized Corporate Treasury group activities, such as management of our corporate
investment portfolio and asset/liability management, to our business segments as well as other items as described in “Note 20—Business
Segments.”
(4) During the first quarter of 2009, the results relating to Chevy Chase Bank were included in the Other category.