Capital One 2010 Annual Report Download - page 132
Download and view the complete annual report
Please find page 132 of the 2010 Capital One annual report below. You can navigate through the pages in the report by either clicking on the pages listed below, or by using the keyword search tool below to find specific information within the annual report.-
 1
1 -
2
-
3
-
4
-
5
-
6
-
7
-
8
-
9
-
10
-
11
-
12
-
13
-
14
-
15
-
16
-
17
-
18
-
19
-
20
-
21
-
22
-
23
-
24
-
25
-
26
-
27
-
28
-
29
-
30
-
31
-
32
-
33
-
34
-
35
-
36
-
37
-
38
-
39
-
40
-
41
-
42
-
43
-
44
-
45
-
46
-
47
-
48
-
49
-
50
-
51
-
52
-
53
-
54
-
55
-
56
-
57
-
58
-
59
-
60
-
61
-
62
-
63
-
64
-
65
-
66
-
67
-
68
-
69
-
70
-
71
-
72
-
73
-
74
-
75
-
76
-
77
-
78
-
79
-
80
-
81
-
82
-
83
-
84
-
85
-
86
-
87
-
88
-
89
-
90
-
91
-
92
-
93
-
94
-
95
-
96
-
97
-
98
-
99
-
100
-
101
-
102
-
103
-
104
-
105
-
106
-
107
-
108
-
109
-
110
-
111
-
112
-
113
-
114
-
115
-
116
-
117
-
118
-
119
-
120
-
121
-
 122
122 -
 123
123 -
 124
124 -
 125
125 -
 126
126 -
 127
127 -
 128
128 -
 129
129 -
 130
130 -
 131
131 -
 132
132 -
 133
133 -
 134
134 -
 135
135 -
 136
136 -
 137
137 -
 138
138 -
 139
139 -
 140
140 -
 141
141 -
 142
142 -
143
-
144
-
145
-
146
-
147
-
148
-
149
-
150
-
151
-
152
-
153
-
154
-
155
-
156
-
157
-
158
-
159
-
160
-
161
-
162
-
163
-
164
-
165
-
166
-
167
-
168
-
169
-
170
-
171
-
172
-
173
-
174
-
175
-
176
-
177
-
178
-
179
-
180
-
181
-
182
-
183
-
184
-
185
-
186
-
187
-
188
-
189
-
190
-
191
-
192
-
193
-
194
-
195
-
196
-
197
-
198
-
199
-
200
-
201
-
202
-
203
-
204
-
205
-
206
-
207
-
208
-
209
-
210
-
211
-
212
-
213
-
214
-
215
-
216
-
217
-
218
-
219
-
220
-
221
-
222
-
223
-
224
-
225
-
226
 |
 |

CAPITAL ONE FINANCIAL CORPORATION
NOTES TO CONSOLIDATED STATEMENTS
112
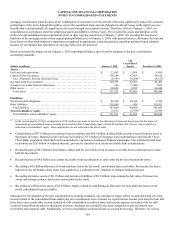
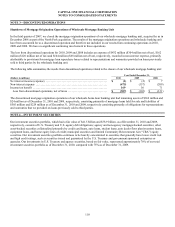
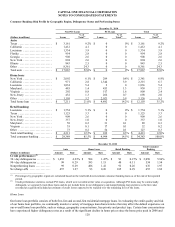
(3) Consists of debt securities issued by Fannie Mae and Freddie Mac with amortized costs of $200 million and $454 million, as of December 31,
2010 and 2009, respectively, and fair values of $213 million and $476 million, as of December 31, 2010 and 2009, respectively.
(4) Consists of mortgage-backed securities issued by Fannie Mae, Freddie Mac and Ginnie Mae with amortized costs of $17.1 billion, $8.1 billion
and $2.9 billion, respectively, and fair values of $17.3 billion, $8.3 billion and $3.0 billion, respectively, as of December 31, 2010. The book
value of Fannie Mae, Freddie Mac and Ginnie Mae investments exceeded 10% of our stockholders’ equity as of December 31, 2010.
(5) Consists of securities collateralized by credit card loans, auto loans, auto dealer floor plan inventory loans, equipment loans, and home equity
lines of credit. The distribution among these asset types was approximately 77.8 % credit card loans, 7.2% student loans, 6.7% auto loans, 5.6%
auto dealer floor plan inventory loans, 2.5 % equipment loans, and 0.2% home equity lines of credit as of December 31, 2010. In comparison,
the distribution was approximately 76.3% credit card loans, 6.9% student loans, 14.0% auto loans, 1.7% auto dealer floor plan inventory loans,
0.8% equipment loans and 0.3% home equity lines of credit as of December 31, 2009. Approximately 90.1 % of the securities in our asset-
backed security portfolio were rated AAA or its equivalent as of December 31, 2010, compared with 84.2% as of December 31, 2009.
(6) Consists of municipal securities and equity investments, primarily related to CRA activities.
(7) Consists of negative amortization mortgage-backed securities.
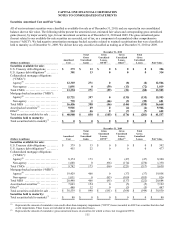
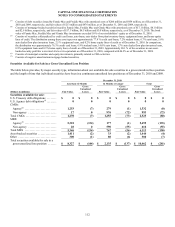
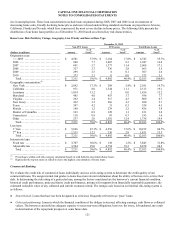
Securities Available for Sale in a Gross Unrealized Loss Position
The table below provides, by major security type, information about our available-for-sale securities in a gross unrealized loss position
and the length of time that individual securities have been in a continuous unrealized loss position as of December 31, 2010 and 2009.
December 31, 2010
Less than 12 Months 12 Months or Longer Total
(Dollars in millions) Fair Value
Gross
Unrealized
Losses Fair Value
Gross
Unrealized
Losses Fair Value
Gross
Unrealized
Losses
Securities available for sale:
U.S. Treasury debt obligations ........ $ 0 $ 0 $ 0 $ 0 $ 0 $ 0
U.S. Agency debt obligations(1) ........ 0 0 0 0 0 0
CMOs:
Agency(2) .......................... 1,253 (7) 279 (1) 1,532 (8)
Non-agency ....................... 17 0 976 (72) 993 (72)
Total CMOs ......................... 1,270 (7) 1,255 (73) 2,525 (80)
MBS:
Agency(2) .......................... 5,318 (134) 177 (1) 5,495 (135)
Non-agency ....................... 28 0 590 (55) 618 (55)
Total MBS .......................... 5,346 (134) 767 (56) 6,113 (190)
Asset-backed securities ............... 1,411 (2) 33 (2) 1,444 (4)
Other ............................... 300 (1) 80 (6) 380 (7)
Total securities available for sale in a
gross unrealized loss position ....... $ 8,327 $ (144) $ 2,135 $ (137) $ 10,462 $ (281)