Capital One 2010 Annual Report Download - page 59
Download and view the complete annual report
Please find page 59 of the 2010 Capital One annual report below. You can navigate through the pages in the report by either clicking on the pages listed below, or by using the keyword search tool below to find specific information within the annual report.-
 1
1 -
2
-
3
-
4
-
5
-
6
-
7
-
8
-
9
-
10
-
11
-
12
-
13
-
14
-
15
-
16
-
17
-
18
-
19
-
20
-
21
-
22
-
23
-
24
-
25
-
26
-
27
-
28
-
29
-
30
-
31
-
32
-
33
-
34
-
35
-
36
-
37
-
38
-
39
-
40
-
41
-
42
-
43
-
44
-
45
-
46
-
47
-
48
-
 49
49 -
 50
50 -
 51
51 -
 52
52 -
 53
53 -
 54
54 -
 55
55 -
 56
56 -
 57
57 -
 58
58 -
 59
59 -
 60
60 -
 61
61 -
 62
62 -
 63
63 -
 64
64 -
 65
65 -
 66
66 -
 67
67 -
 68
68 -
 69
69 -
70
-
71
-
72
-
73
-
74
-
75
-
76
-
77
-
78
-
79
-
80
-
81
-
82
-
83
-
84
-
85
-
86
-
87
-
88
-
89
-
90
-
91
-
92
-
93
-
94
-
95
-
96
-
97
-
98
-
99
-
100
-
101
-
102
-
103
-
104
-
105
-
106
-
107
-
108
-
109
-
110
-
111
-
112
-
113
-
114
-
115
-
116
-
117
-
118
-
119
-
120
-
121
-
122
-
123
-
124
-
125
-
126
-
127
-
128
-
129
-
130
-
131
-
132
-
133
-
134
-
135
-
136
-
137
-
138
-
139
-
140
-
141
-
142
-
143
-
144
-
145
-
146
-
147
-
148
-
149
-
150
-
151
-
152
-
153
-
154
-
155
-
156
-
157
-
158
-
159
-
160
-
161
-
162
-
163
-
164
-
165
-
166
-
167
-
168
-
169
-
170
-
171
-
172
-
173
-
174
-
175
-
176
-
177
-
178
-
179
-
180
-
181
-
182
-
183
-
184
-
185
-
186
-
187
-
188
-
189
-
190
-
191
-
192
-
193
-
194
-
195
-
196
-
197
-
198
-
199
-
200
-
201
-
202
-
203
-
204
-
205
-
206
-
207
-
208
-
209
-
210
-
211
-
212
-
213
-
214
-
215
-
216
-
217
-
218
-
219
-
220
-
221
-
222
-
223
-
224
-
225
-
226
 |
 |

39
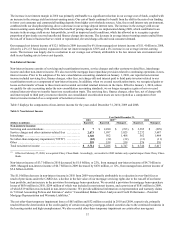
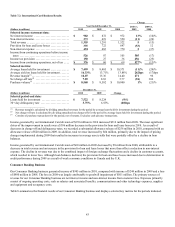
Income Taxes
Our effective income tax rate based on income from continuing operations was 29.56%, 26.16% and 85.47% in 2010, 2009 and 2008,
respectively. The variance in our effective tax rate between periods is due, in part, to fluctuations in our pre-tax earnings, which
affects the relative tax benefit of tax-exempt income, tax credits and permanent tax items.
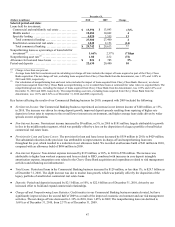
The increase in our effective tax rate in 2010 from 2009 reflected the reduced relative benefit of tax-exempt income and tax credits as
a result of the increase in our pre-tax earnings. We recorded a $90 million tax benefit primarily related to the settlement of certain pre-
acquisition tax liabilities related to North Fork and the resolution of certain tax issues before the U.S. Tax Court in 2010, which
partially offset the increase in our effective tax rate for this period.
The significant decrease in our effective income tax rate in 2009 from 2008 was primarily attributable to the goodwill impairment
charge of $811 million recorded in 2008, a portion of which was non-deductible.Our effective tax rate in 2008 excluding the impact of
non-deductible goodwill impairment was 37.8%. In addition, increased tax credits, reductions in unrecognized tax benefits due to tax
settlements and resolutions and changes in our international tax position had a favorable impact on our 2009 effective tax rate.
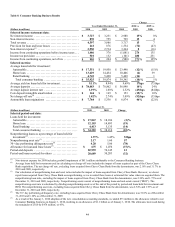
Loss from Discontinued Operations, Net of Tax
Loss from discontinued operations reflects ongoing costs, which primarily consist of mortgage loan repurchase representation and
warranty charges, related to the mortgage origination operations of GreenPoint’s wholesale mortgage banking unit, which we closed
in 2007. We recorded a loss from discontinued operations, net of tax, of $307 million, $103 million and $131 million in 2010, 2009
and 2008, respectively.
The significant increase in loss from discontinued operations in 2010 was attributable to the increase in our mortgage loan repurchase
representation and warranty reserves. We recorded a pre-tax provision for mortgage loan repurchase exposure of $636 million in 2010,
of which $432 million ($304 million net of tax) was included in discontinued operations. In comparison, we recorded a pre-tax
provision for mortgage loan repurchase exposure of $181 million in 2009, of which $162 million ($120 million net of tax) was
included in discontinued operations.
We provide additional information on representation and warranty claims in “Critical Accounting Polices and Estimates” and in
“Consolidated Balance Sheet Analysis and Credit Performance—Potential Mortgage Representation and Warranty Liabilities.”
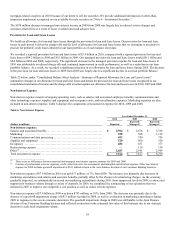
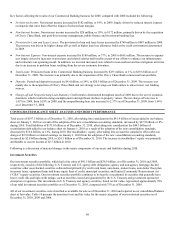
BUSINESS SEGMENT FINANCIAL PERFORMANCE
Our principal operations are currently organized into three major business segments, which are defined based on the products and
services provided, or the type of customer served: Credit Card, Consumer Banking and Commercial Banking. The operations of
acquired businesses have been integrated into our existing business segments.
The results of our individual businesses, which we report on a continuing operations basis, reflect the manner in which management
evaluates performance and makes decisions about funding our operations and allocating resources. Our business segment results are
intended to reflect each segment as if it were a stand-alone business. We use an internal management and reporting process to derive
our business segment results. Our internal management and reporting process employs various allocation methodologies, including
funds transfer pricing, to assign certain managed balance sheet assets, deposits and other liabilities and their related revenue and
expenses directly or indirectly attributable to each business segment.
We refer to the business segment results derived from our internal management accounting and reporting process as our “managed”
presentation, which differs in some cases from our reported results prepared based on U.S. GAAP. There is no comprehensive,
authoritative body of guidance for management accounting equivalent to U.S. GAAP; therefore, the managed basis presentation of our
business segment results may not be comparable to similar information provided by other financial service companies. In addition, our
individual business segment results should not be used as a substitute for comparable results determined in accordance with U.S.
GAAP. We provide additional information on our business segments, including the basis of presentation, business segment reporting
methodologies, and a reconciliation of our total business segment results to our reported consolidated results in “Note 20—Business
Segments.”
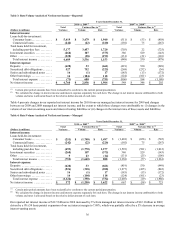
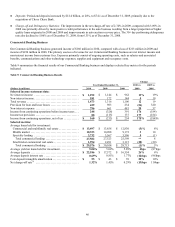
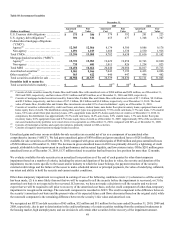
We summarize our business segment results for 2010, 2009 and 2008 in the tables below and provide a comparative discussion of
these results. We may periodically change our business segments or reclassify business segment results based on modifications to our
management reporting methodologies and changes in organizational alignment. In 2009, we realigned our organizational structure and
business segment reporting to reflect our operating results by product type and customer segment and to integrate the operations of
Chevy Chase Bank. Prior period amounts have been recast to conform to the current period presentation. We provide information on
the outlook for each of our business segments above under “Executive Summary and Business Outlook.”