Capital One 2010 Annual Report Download - page 145
Download and view the complete annual report
Please find page 145 of the 2010 Capital One annual report below. You can navigate through the pages in the report by either clicking on the pages listed below, or by using the keyword search tool below to find specific information within the annual report.-
 1
1 -
2
-
3
-
4
-
5
-
6
-
7
-
8
-
9
-
10
-
11
-
12
-
13
-
14
-
15
-
16
-
17
-
18
-
19
-
20
-
21
-
22
-
23
-
24
-
25
-
26
-
27
-
28
-
29
-
30
-
31
-
32
-
33
-
34
-
35
-
36
-
37
-
38
-
39
-
40
-
41
-
42
-
43
-
44
-
45
-
46
-
47
-
48
-
49
-
50
-
51
-
52
-
53
-
54
-
55
-
56
-
57
-
58
-
59
-
60
-
61
-
62
-
63
-
64
-
65
-
66
-
67
-
68
-
69
-
70
-
71
-
72
-
73
-
74
-
75
-
76
-
77
-
78
-
79
-
80
-
81
-
82
-
83
-
84
-
85
-
86
-
87
-
88
-
89
-
90
-
91
-
92
-
93
-
94
-
95
-
96
-
97
-
98
-
99
-
100
-
101
-
102
-
103
-
104
-
105
-
106
-
107
-
108
-
109
-
110
-
111
-
112
-
113
-
114
-
115
-
116
-
117
-
118
-
119
-
120
-
121
-
122
-
123
-
124
-
125
-
126
-
127
-
128
-
129
-
130
-
131
-
132
-
133
-
134
-
 135
135 -
 136
136 -
 137
137 -
 138
138 -
 139
139 -
 140
140 -
 141
141 -
 142
142 -
 143
143 -
 144
144 -
 145
145 -
 146
146 -
 147
147 -
 148
148 -
 149
149 -
 150
150 -
 151
151 -
 152
152 -
 153
153 -
 154
154 -
 155
155 -
156
-
157
-
158
-
159
-
160
-
161
-
162
-
163
-
164
-
165
-
166
-
167
-
168
-
169
-
170
-
171
-
172
-
173
-
174
-
175
-
176
-
177
-
178
-
179
-
180
-
181
-
182
-
183
-
184
-
185
-
186
-
187
-
188
-
189
-
190
-
191
-
192
-
193
-
194
-
195
-
196
-
197
-
198
-
199
-
200
-
201
-
202
-
203
-
204
-
205
-
206
-
207
-
208
-
209
-
210
-
211
-
212
-
213
-
214
-
215
-
216
-
217
-
218
-
219
-
220
-
221
-
222
-
223
-
224
-
225
-
226
 |
 |

CAPITAL ONE FINANCIAL CORPORATION
NOTES TO CONSOLIDATED STATEMENTS
125
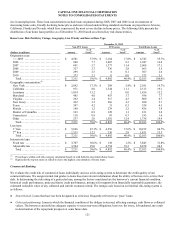
The following table presents changes in the accretable yield related to the acquired Chevy Chase Bank loans:
(Dollars in millions)
Total
Acquired
Loans
Purchased
Credit-
Impaired
Loans
Non-
Impaired
Loans
Accretable yield as of December 31, 2008 ....................................... $ 0 $ 0 $ 0
Additions from new acquisitions ............................................. 2,360 1,861 499
Accretion recognized in earnings ............................................. (293) (119) (174)
Accretable yield as of December 31, 2009 ....................................... 2,067 1,742 325
Accretion recognized in earnings ............................................. (405) (299) (106)
Reclassifications from nonaccretable difference for loans with improvement in
expected cash flows ....................................................... 350 311 39
Accretable yield as of December 31, 2010 ....................................... $ 2,012 $ 1,754 $ 258
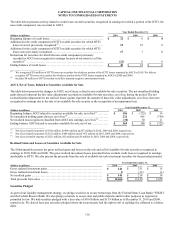
Unfunded Lending Commitments
We manage the potential risk in credit commitments by limiting the total amount of arrangements, both by individual customer and in
total, by monitoring the size and maturity structure of these portfolios and by applying the same credit standards for all of our credit
activities. Unused credit card lines available to our customers totaled $161.5 billion and $154.9 billion as of December 31, 2010 and
2009, respectively. While these amounts represented the total available unused credit card lines, we have not experienced, and do not
anticipate, that all of our customers will access their entire available line at any given point in time.
In addition to available unused credit card lines, we enter into commitments to extend credit that are legally binding conditional
agreements having fixed expirations or termination dates and specified interest rates and purposes. These commitments generally
require customers to maintain certain credit standards. Collateral requirements and loan-to-value ratios are the same as those for
funded transactions and are established based on management’s credit assessment of the customer. Commitments may expire without
being drawn upon. Therefore, the total commitment amount does not necessarily represent future funding requirements. The
outstanding unfunded commitments to extend credit other than credit card lines were approximately $13.2 billion and $12.0 billion as
of December, 2010 and 2009, respectively.
We maintain a reserve for unfunded loan commitments and letters of credit to absorb estimated probable losses related to these
unfunded credit facilities in other liabilities, which is presented below in “Note 6—Allowance for Loan and Lease Losses.”
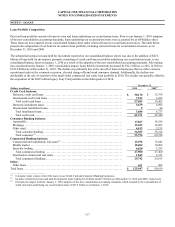
NOTE 6—ALLOWANCE FOR LOAN AND LEASE LOSSES
We maintain an allowance for loan and lease losses that represents management’s best estimate of incurred loan and lease credit losses
inherent in our held-for-investment portfolio as of each balance sheet date. In determining the allowance for loan and lease losses, we
disaggregate loans in our portfolio with similar credit risk characteristics into portfolio segments. See “Note 1—Summary of
Significant Accounting Policies” for additional information.
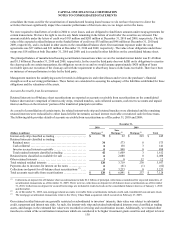
Allowance for Loan and Lease Losses Activity
The allowance for loan and lease losses is increased through the provision for loan and lease losses and reduced by net charge-offs.
The provision for loan and lease losses, which is charged to earnings, reflects credit losses we believe have been incurred and will
eventually be reflected over time in our charge-offs. Charge-offs of uncollectible amounts are deducted from the allowance and
subsequent recoveries are included. The table below summarizes changes in the allowance for loan and lease losses, by portfolio
segment, for 2010 and 2009.