Capital One 2010 Annual Report Download - page 100
Download and view the complete annual report
Please find page 100 of the 2010 Capital One annual report below. You can navigate through the pages in the report by either clicking on the pages listed below, or by using the keyword search tool below to find specific information within the annual report.-
 1
1 -
2
-
3
-
4
-
5
-
6
-
7
-
8
-
9
-
10
-
11
-
12
-
13
-
14
-
15
-
16
-
17
-
18
-
19
-
20
-
21
-
22
-
23
-
24
-
25
-
26
-
27
-
28
-
29
-
30
-
31
-
32
-
33
-
34
-
35
-
36
-
37
-
38
-
39
-
40
-
41
-
42
-
43
-
44
-
45
-
46
-
47
-
48
-
49
-
50
-
51
-
52
-
53
-
54
-
55
-
56
-
57
-
58
-
59
-
60
-
61
-
62
-
63
-
64
-
65
-
66
-
67
-
68
-
69
-
70
-
71
-
72
-
73
-
74
-
75
-
76
-
77
-
78
-
79
-
80
-
81
-
82
-
83
-
84
-
85
-
86
-
87
-
88
-
89
-
 90
90 -
 91
91 -
 92
92 -
 93
93 -
 94
94 -
 95
95 -
 96
96 -
 97
97 -
 98
98 -
 99
99 -
 100
100 -
 101
101 -
 102
102 -
 103
103 -
 104
104 -
 105
105 -
 106
106 -
 107
107 -
 108
108 -
 109
109 -
 110
110 -
111
-
112
-
113
-
114
-
115
-
116
-
117
-
118
-
119
-
120
-
121
-
122
-
123
-
124
-
125
-
126
-
127
-
128
-
129
-
130
-
131
-
132
-
133
-
134
-
135
-
136
-
137
-
138
-
139
-
140
-
141
-
142
-
143
-
144
-
145
-
146
-
147
-
148
-
149
-
150
-
151
-
152
-
153
-
154
-
155
-
156
-
157
-
158
-
159
-
160
-
161
-
162
-
163
-
164
-
165
-
166
-
167
-
168
-
169
-
170
-
171
-
172
-
173
-
174
-
175
-
176
-
177
-
178
-
179
-
180
-
181
-
182
-
183
-
184
-
185
-
186
-
187
-
188
-
189
-
190
-
191
-
192
-
193
-
194
-
195
-
196
-
197
-
198
-
199
-
200
-
201
-
202
-
203
-
204
-
205
-
206
-
207
-
208
-
209
-
210
-
211
-
212
-
213
-
214
-
215
-
216
-
217
-
218
-
219
-
220
-
221
-
222
-
223
-
224
-
225
-
226
 |
 |

80
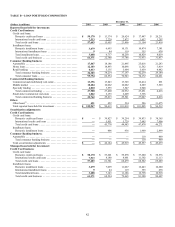
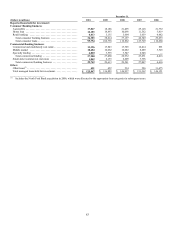
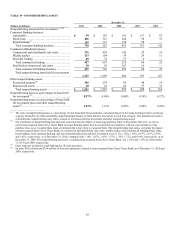
SUPPLEMENTAL STATISTICAL TABLES
TABLE A—STATEMENTS OF AVERAGE BALANCES, INCOME AND EXPENSE, YIELDS AND RATES
Table A presents average balance sheet data and an analysis of reported and managed net interest income, net interest spread (the difference
between the yield on interest-earning assets and the cost of interest-bearing liabilities) and net interest margin for 2010, 2009 and 2008.
Reported Basis
Year Ended December 31,
2010 2009(1) 2008(1)
(Dollars in millions)
Average
Balance
Interest
Income/
Expense(2)
Yield/
Rate
Average
Balance
Interest
Income/
Expense(2)
Yield/
Rate
Average
Balance
Interest
Income/
Expense(2)
Yield/
Rate
Assets:
Interest-earning assets:
Consumer loans:(3)
Domestic ......................
.
$ 91,451 $ 11,444 12.51% $ 67,160 $ 6,889 10.26 % $ 66,811 $ 7,303 10.93%
International ...................
.
7,499 1,212 16.16 2,613 348 13.31 3,446 445 12.90
Total consumer loans ...............
.
98,950 12,656 12.79 69,773 7,237 10.37 70,257 7,748 11.03
Commercial loans .................
.
29,576 1,278 4.32 30,014 1,520 5.06 28,714 1,712 5.96
Total loans held for investment ........
.
128,526 13,934 10.84 99,787 8,757 8.78 98,971 9,460 9.56
Investment securities ...............
.
39,489 1,342 3.40 36,910 1,610 4.36 25,043 1,224 4.89
Other interest-earning assets:
Domestic ......................
.
7,129 75 1.05 7,489 290 3.87 8,030 407 5.06
International ...................
.
586 2 0.34 1,107 7 0.64 1,040 21 2.05
Total other .......................
.
7,715 77 1.00 8,596 297 3.46 $ 9,070 428 4.71
Total interest-earning assets(4) .........
.
$ 175,730 $ 15,353 8.74% $ 145,293 $ 10,664 7.34 % $ 133,084 $ 11,112 8.35%
Cash and due from banks(4) ...........
.
2,128 3,476 2,128
Allowance for loan and lease losses(4) . . .
.
(7,257) (4,470) (3,267)
Premises and equipment, net(4) ........
.
2,718 2,718 2,318
Other assets ......................
.
26,752 24,557 21,964
Total assets from discontinued operations
.
43 24 65
Total assets ......................
.
$ 200,114 $ 171,598 $ 156,292
Liabilities and Equity:
Interest-bearing liabilities:
Deposits:
Domestic ......................
.
$ 104,743 $ 1,465 1.40% $ 102,337 $ 2,070 2.02 % $ 79,294 $ 2,422 3.06%
International(5) ..................
.
—
—
—
741 23 3.10 3,442 90 2.60
Total deposits ....................
.
104,743 1,465 1.40 103,078 2,093 2.03 82,736 2,512 3.04
Securitized debt:
Domestic ......................
.
29,275 686 2.34 5,516 282 5.11 10,010 550 5.49
International ...................
.
4,910 123 2.51
—
—
—
—
—
—
Total securitized debt ...............
.
34,185 809 2.37 5,516 282 5.11 10,010 550 5.49
Senior and subordinated notes ........
.
8,571 276 3.22 8,607 260 3.02 8,881 445 5.01
Other borrowings:
Domestic ......................
.
5,082 333 6.55 7,941 321 4.04 11,166 444 3.98
International ...................
.
1,772 13 0.73 1,441 11 0.76 1,039 12 1.15
Total other borrowings ..............
.
6,854 346 5.05 9,382 332 3.54 12,205 456 3.74
Total interest-bearing liabilities(4) ......
.
$ 154,353 $ 2,896 1.88% $ 126,583 $ 2,967 2.34 % $ 113,832 $ 3,963 3.48%
Non-interest bearing deposits(4) ........
.
14,267 12,523 10,772
Other liabilities(4) ..................
.
6,105 5,737 6,261
Total liabilities from discontinued
operations .....................
.
448 149 149
Total liabilities ...................
.
175,173 144,992 131,014
Stockholders’ equity(6) ..............
.
24,941 26,606 25,278
Total liabilities and stockholders’ equity $ 200,114 $ 171,598 $ 156,292
Net interest income/spread .........
.
$ 12,457 6.86% $ 7,697 5.00 % $ 7,149 4.87%
Interest income to average earning assets
.
8.74% 7.34 % 8.35%
Interest expense to average earning assets
.
1.65 2.04 2.97
Net interest margin ..............
.
7.09% 5.30 % 5.38%
________________________
(1) Certain prior period amounts have been reclassified to conform to the current period presentation.
(2) Past due fees included in interest income totaled approximately $1.1 billion, $652 million and $695 million on a reported basis for the years
ended December 31, 2010, 2009 and 2008, respectively.
(3) Interest income on credit card, auto, home and retail banking loans is reflected in consumer loans. Interest income generated from small business
credit cards also is included in consumer loans.
(4) Based on continuing operations.
(5) The U.K. deposit business, which was included in international deposits, was sold during the third quarter of 2009.
(6) Includes a reduction of $2.9 billion recorded on January 1, 2010, in conjunction with the adoption of the new consolidation accounting guidance.