Capital One 2010 Annual Report Download - page 97
Download and view the complete annual report
Please find page 97 of the 2010 Capital One annual report below. You can navigate through the pages in the report by either clicking on the pages listed below, or by using the keyword search tool below to find specific information within the annual report.-
 1
1 -
2
-
3
-
4
-
5
-
6
-
7
-
8
-
9
-
10
-
11
-
12
-
13
-
14
-
15
-
16
-
17
-
18
-
19
-
20
-
21
-
22
-
23
-
24
-
25
-
26
-
27
-
28
-
29
-
30
-
31
-
32
-
33
-
34
-
35
-
36
-
37
-
38
-
39
-
40
-
41
-
42
-
43
-
44
-
45
-
46
-
47
-
48
-
49
-
50
-
51
-
52
-
53
-
54
-
55
-
56
-
57
-
58
-
59
-
60
-
61
-
62
-
63
-
64
-
65
-
66
-
67
-
68
-
69
-
70
-
71
-
72
-
73
-
74
-
75
-
76
-
77
-
78
-
79
-
80
-
81
-
82
-
83
-
84
-
85
-
86
-
 87
87 -
 88
88 -
 89
89 -
 90
90 -
 91
91 -
 92
92 -
 93
93 -
 94
94 -
 95
95 -
 96
96 -
 97
97 -
 98
98 -
 99
99 -
 100
100 -
 101
101 -
 102
102 -
 103
103 -
 104
104 -
 105
105 -
 106
106 -
 107
107 -
108
-
109
-
110
-
111
-
112
-
113
-
114
-
115
-
116
-
117
-
118
-
119
-
120
-
121
-
122
-
123
-
124
-
125
-
126
-
127
-
128
-
129
-
130
-
131
-
132
-
133
-
134
-
135
-
136
-
137
-
138
-
139
-
140
-
141
-
142
-
143
-
144
-
145
-
146
-
147
-
148
-
149
-
150
-
151
-
152
-
153
-
154
-
155
-
156
-
157
-
158
-
159
-
160
-
161
-
162
-
163
-
164
-
165
-
166
-
167
-
168
-
169
-
170
-
171
-
172
-
173
-
174
-
175
-
176
-
177
-
178
-
179
-
180
-
181
-
182
-
183
-
184
-
185
-
186
-
187
-
188
-
189
-
190
-
191
-
192
-
193
-
194
-
195
-
196
-
197
-
198
-
199
-
200
-
201
-
202
-
203
-
204
-
205
-
206
-
207
-
208
-
209
-
210
-
211
-
212
-
213
-
214
-
215
-
216
-
217
-
218
-
219
-
220
-
221
-
222
-
223
-
224
-
225
-
226
 |
 |

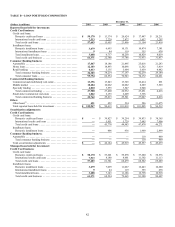
77
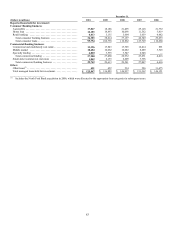
Table 36: Capital Ratios(1)
December 31,
2010 2009
(Dollars in millions)
Capital
Ratio
Minimum
Capital
Adequacy
Well
Capitalized
Capital
Ratio
Minimum
Capital
Adequacy
Well
Capitalized
Capital One Financial Corp: (2)
Tier 1 common equity(3) ......... 8.78% N/A N/A 10.62% N/A N/A
Tier 1 risk-based capital(4) ........ 11.63 4.00% 6.00% 13.75 4.00% 6.00%
Total risk-based capital(5) ........ 16.83 8.00 10.00 17.70 8.00 10.00
Tier 1 leverage(6) ................ 8.13 4.00 N/A 10.28 4.00 N/A
Capital One Bank (USA) N.A.
Tier 1 risk-based capital ......... 13.50% 4.00% 6.00% 18.27% 4.00% 6.00%
Total risk-based capital .......... 23.57 8.00 10.00 26.40 8.00 10.00
Tier 1 leverage .................. 8.29 4.00 5.00 13.03 4.00 5.00
Capital One, N.A.
Tier 1 risk-based capital ......... 11.07% 4.00% 6.00% 10.22% 4.00% 6.00%
Total risk-based capital .......... 12.36 8.00 10.00 11.46 8.00 10.00
Tier 1 leverage .................. 8.06 4.00 5.00 7.42 4.00 5.00
________________________
(1) Effective January 1, 2010, we are no longer required to apply the subprime capital risk weighting to credit card loans with a credit score equal to
or lessr than 660. Accordingly, we no longer disclose these ratios.
(2) The regulatory framework for prompt corrective action does not apply to Capital One Financial Corp. because it is a bank holding company.
(3) Tier 1 common equity ratio is a non-GAAP measure calculated based on Tier 1 common equity divided by risk-weighted assets.
(4) Calculated based on Tier 1 capital divided by risk-weighted assets.
(5) Calculated based on Total risk-based capital divided by risk-weighted assets.
(6) Calculated based on Tier 1 capital divided by quarterly average total assets, after certain adjustments.
The January 1, 2010 adoption of the new consolidation accounting standards resulted in our consolidating a substantial portion of our
securitization trusts and establishing an allowance for loan and lease losses for the assets underlying these trusts, which reduced
retained earnings and our Tier 1 risk-based capital ratio. In January 2010, banking regulators issued regulatory capital rules related to
the impact of the new consolidation accounting standards. Under these rules, we are required to hold additional capital for the assets
we consolidated. The capital rules also provided for an optional phase-in of the impact from the adoption of the new consolidation
accounting standards, including a two-quarter implementation delay followed by a two-quarter partial implementation of the effect on
regulatory capital ratios.
We elected the phase-in option, which required us to phase-in 50% of consolidated assets beginning with the third quarter of 2010 for
purposes of determining risk-weighted assets. However, the phase-in impact was effectively accelerated over the first three quarters of
2010 due to pay downs of outstanding securitization debt. The phase-in provisions expired after December 31, 2010, and the full
impact of the consolidated assets on capital ratios will be realized in the first quarter of 2011.
Under the Dodd-Frank Act, many trust preferred securities will cease to qualify for Tier 1 capital, subject to a three year phase-out
period expected to begin in 2013. See “Supervision and Regulation” for more information.
Dividend Policy
The declaration and payment of dividends to our stockholders, as well as the amount thereof, are subject to the discretion of the our
Board of Directors and will depend upon our results of operations, financial condition, capital levels, cash requirements, future
prospects and other factors deemed relevant by the Board of Directors. As a bank holding company, our ability to pay dividends is
largely dependent upon the receipt of dividends or other payments from our subsidiaries. For additional information on dividends, See
“Item 1. Business—Supervision and Regulation—Dividends, Stock Purchases and Transfer of Funds.”
Regulatory restrictions exist that limit the ability of the Banks to transfer funds to us. As of December 31, 2010, funds available for
dividend payments from the Banks were $1.4 billion and zero, respectively. Funds available for dividend payments from the Banks in
the third quarter of 2010 were $803 million and zero, respectively. Although funds are available for dividend payments from COBNA,
we would execute a dividend from COBNA in consultation with the OCC. Additionally, a dividend payment by CONA would require
prior approval of the OCC. Applicable provisions that may be contained in our borrowing agreements or the borrowing agreements of
our subsidiaries may limit our subsidiaries’ ability to pay dividends to us or our ability to pay dividends to our stockholders. There can
be no assurance that we will declare and pay any dividends.